If you've been watching the markets closely, you may have noticed something odd — or maybe not so odd if you've been here long enough: coins like LINK, BNB, AVAX, OP, DOGE, BTC, and ETH are all showing very similar behavior on the 4-hour timeframe.
You’re not imagining things. This kind of synchronized movement across the market is very real — and it tells a bigger story about how crypto markets function beneath the surface.
The Pattern: What We’re Seeing
Across these major assets, the charts show:
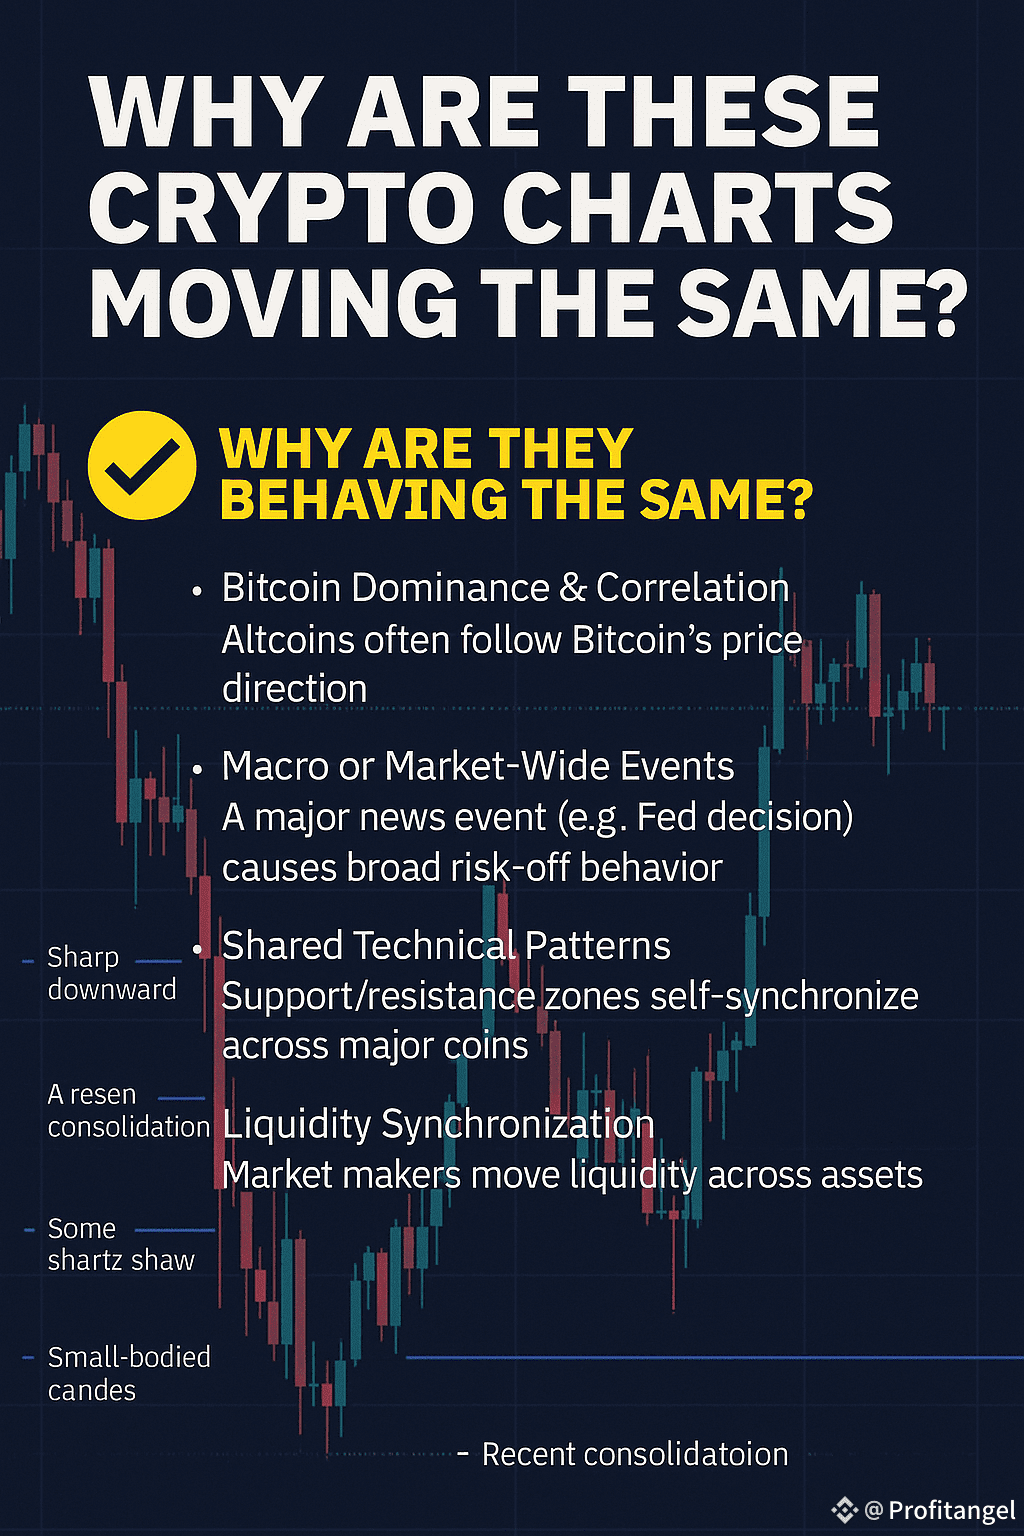
Sharp downward moves
Recent consolidation in tight ranges
Reactions to supply and demand zones in the same structure
Small-bodied candles reflecting low volatility and indecision
This isn’t coincidence. It’s a reflection of market mechanics — and here’s why it happens.
Why Are They Behaving the Same?
1. Bitcoin Dominance & Correlation
Bitcoin is still the king of crypto. When Bitcoin dumps or consolidates, most altcoins follow suit — especially those with high market caps like ETH, BNB, and LINK.
Ethereum also plays a leadership role, but BTC is the ultimate driver. When both BTC and ETH move sideways or sharply down, other coins almost always respond in kind.
2. Macro or Market-Wide Influences
Events like interest rate decisions, inflation updates, or geopolitical headlines affect the broader financial market — and crypto is no exception.
Even in the absence of major news, coordinated actions from market makers can cause synchronized movement across assets. These can include:
Liquidity hunts
Range-bound traps
Sudden wicks during low-volume periods
3. Shared Technical Setups
Many traders use the same tools: trendlines, Fibonacci levels, and horizontal support/resistance zones. This often results in price action becoming self-fulfilling across multiple assets.
For example, if BTC hits a resistance level, a large number of altcoins tend to hit theirs too. This is because of structural mirroring — price patterns repeating across different charts due to similar trading behavior.
4. Liquidity Synchronization
Liquidity is the invisible thread that connects assets. Market makers often balance liquidity across different coins — especially on major exchanges like Binance.
When BTC consolidates, liquidity providers may keep alts in tight ranges to avoid price decoupling. This causes the entire market to move with a similar rhythm — almost like they're dancing to the same beat.
What This Means for Traders
Seeing these synchronized patterns is not just interesting — it’s powerful. It means you’re starting to understand market structure instead of just chasing isolated setups.
Here's how to trade smarter in this environment:
1. Watch BTC and ETH first before making altcoin decisions.
2. If BTC is ranging or near a key level, expect alts to behave similarly.
3. Use confluence — if several coins are reacting at the same time to key zones, that adds confidence.
4. If BTC is at resistance, avoid opening long positions on alts blindly.
5. Look for divergence: if an alt is decoupling and building strength while BTC ranges, that could be a breakout opportunity.
Final Thoughts
This isn't just about pattern recognition — it’s about understanding how crypto as a whole behaves as one big, interconnected ecosystem. The more you tune into that, the more prepared you are to anticipate moves — not just react to them.
An eye on macro sentiment, BTC dominance, and liquidity behavior can give you a serious edge. You're not just trading a coin — you're trading context. #Binance