ETH technical trend view: Ethereum declined yesterday, dropping from an intraday high of 2601 to a low.
Closed at 2473, down 3.22% to 2506【95 dollars】; the daily line closes with a group close to a dusk star group.
Overall bearish pattern: in terms of indicators, the price has tested the 4-hour EMA, which currently shows some support; this week's market.
The trend is relatively complex; the weekly level is in a rising phase; the daily line shows a bearish pattern, however, at the 4-hour level.
Prices are all at the golden stage of the three moving averages above the Vegas tunnel, along with the rising trend line, all remain effective.
In the middle; this brings certain difficulties in choosing the operation direction; only if one is determined can they make a choice based on ideas.
For the bearish idea to enter short, the daily level support should place the defense above 2650; look.
2200-2100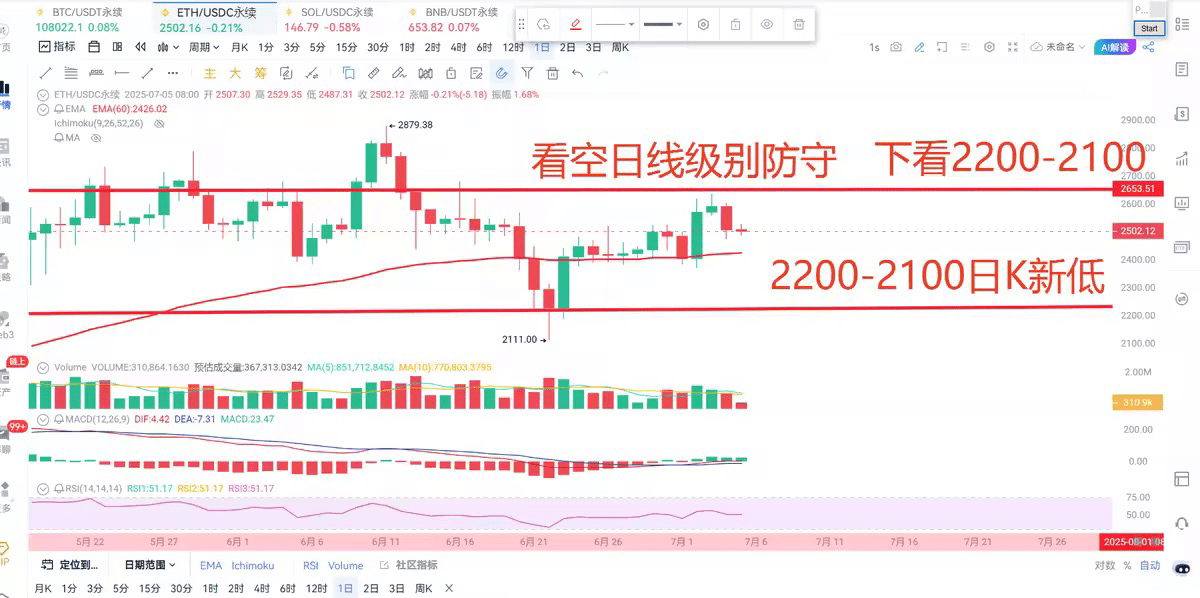
If the idea is bullish: then the weekly cycle aligns, and based on the current 4-hour price, it can be leveraged from 2630.
A bullish engulfing pattern appears near the 2500 retracement; attempt to enter long positions; defend at 2450-
The target is to look up first at 2430, if it strongly breaks through that resistance, it can continue to look towards 2750-2800.
Reminder; the major cycle has shown bullish signals, mainly low entries are welcome to express suggestions.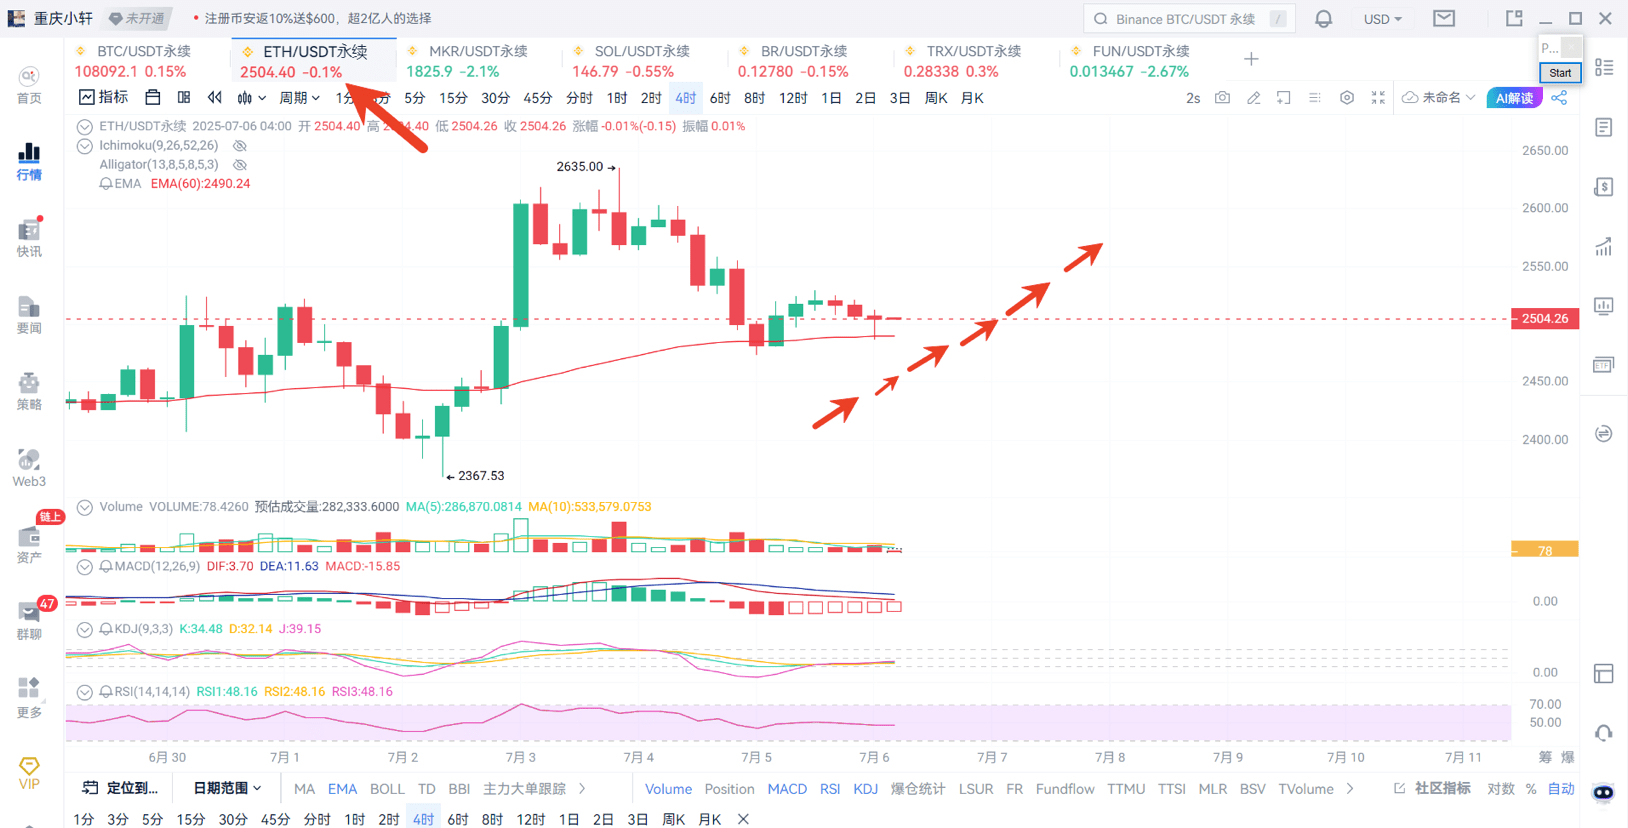
Any short-term trading opportunities today? Specific points to look for? How to find entry opportunities for long and short positions, we will also be in.
For more details on other coin operations and trading issues, welcome to follow Xuan Ge in the live room and discuss with the teachers.
Recommended idea [Bullish]
Pay attention to support/resistance: ETH resistance 2530-2570/support 2473-2434.
For more details, welcome to enter the live discussion and learning exchange!
Afternoon 15:00-17:00
Live room explanation! Public class.
For reference only, not as an investment basis.