The crypto market is like a battlefield, with violent rises and falls in the blink of an eye. Last night’s $ETH bullish real-time technical analysis.#ETH
Clear upward trend: The K-line chart shows an overall upward trajectory, with low points and high points gradually rising, which is the fundamental basis for bullishness. Bulls dominate the market.
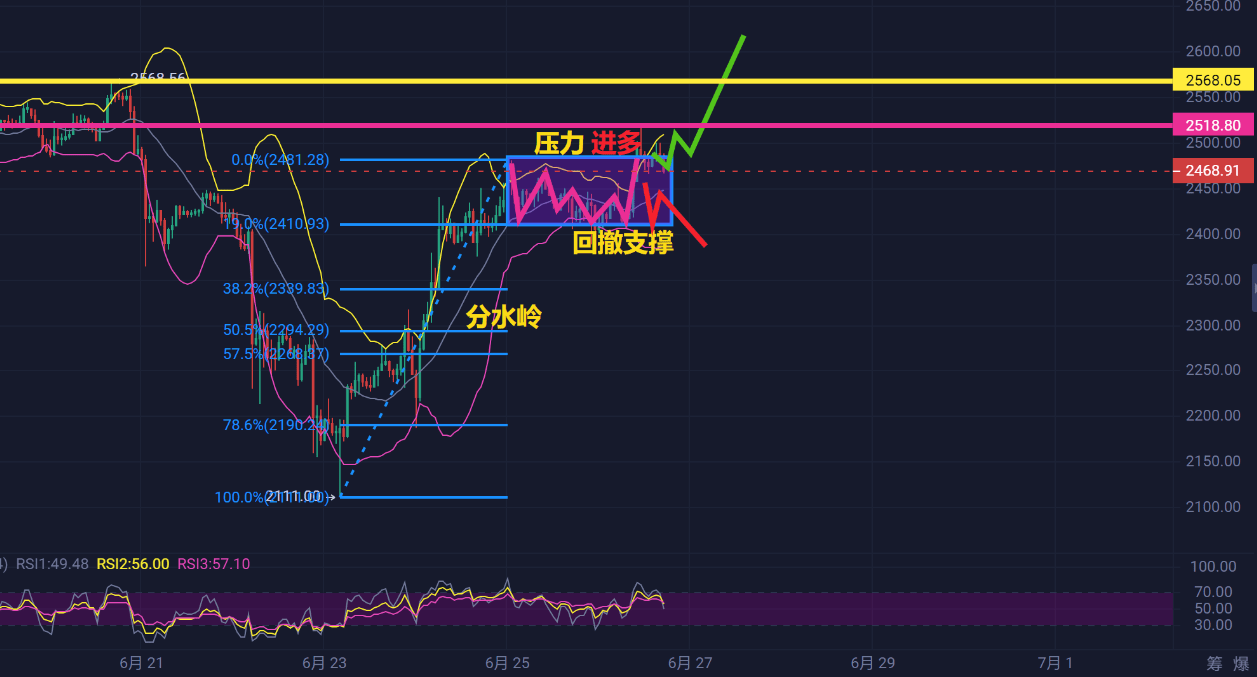
Perfect combination of moving average system: Three different colored lines show a synchronously upward diverging pattern.
Bullish arrangement: Typically, shorter-period moving averages are above longer-period moving averages, and all three are upward, which is a classic 'bullish arrangement'. This indicates strong medium to short-term upward momentum.
Support effect: When the price fluctuates near these upward running moving averages, the moving averages often provide dynamic support. If the price can stabilize above the key moving average during last night's pullback, it is an important entry or holding signal.
Interpretation of the Jin Zhu K-line structure:
Red and green K-line interspersed: Indicates that there is a buy-sell game in the market, but the overall upward trend has not been broken. The position and size of the green bullish candlestick body are the focus of observation. Approaching key resistance: Although the chart shows fluctuations when the price approaches 2520, the key point is that it has not formed a significant 'top pattern', and the overall trend is still within the rising channel. 'Fluctuation' rather than 'reversal'. Support confirmation: Pay attention to whether the price can obtain support and stabilize at the previous high point/dense trading area or key moving averages during the pullback process. Stabilizing at the support level is an important source of bullish confidence. Technical indicators: Although specific indicators are not marked in the chart, the upward divergence of the three key curves itself is a strong signal. The yellow line leading upward usually indicates strong short-term momentum; the gray line going up represents a good mid-term trend.

Disrupting the overall structure.
Market focus: Last night, was there any heavy news affecting the overall cryptocurrency market or ETH itself? For example:
Macroeconomic level: Key economic data releases? Expectations of liquidity from Federal Reserve officials' speeches?
Industry level: SEC-related ETFs or other regulatory dynamics? Progress on Layer 2 networks, major upgrades?
Project level: ETH whale address activity? On-chain Gas fees suddenly surge? Relevant statements from well-known institutions/figures?
The relationship between news and technology:
Good news may further strengthen the bullish signal on the technical side, helping the price break through resistance.
Bad news may trigger a technical pullback, testing the strength of support.
When there are no sudden heavy news: The market is more dominated by technical aspects and on-site sentiment, and the effectiveness of technical analysis is relatively higher at this time. Your operations last night may have been based on this relatively 'calm' or technically dominated market environment.
Key point: Even if the technical outlook is bullish, unexpected shocks from the news front are always a risk factor that needs to be watched. As for real trading operations, stop-loss may be set to cope with this uncertainty.
Personal opinion of Jin Zhu
Technical pattern still leans bullish: The price structure and moving average system shown in the chart clearly indicate that bullish forces are dominant. As long as the key upward trend line and the support below are not effectively broken, the technical outlook maintains a bullish main direction.
The inevitability of challenging resistance levels: Fluctuations near the 2520 level are completely normal resistance effects, and there is no need to over-interpret as 'peaking'. The key is how it performs in this area: is it a volume breakout? A brief pullback followed by another upward attack? Or long-term sideways consumption?
Risk control first:
Pressure: The price is running around 2520. It is necessary to closely monitor the key support area below. If the closing price effectively breaks below the key support, it is necessary to reassess the bullish logic, which may trigger profit-taking or partial profit-taking/stop-loss.
Beware of false breakouts: If the price quickly surges to 2520 but cannot stabilize, caution is required.
Position management: Even if bullish, it is not advisable to bet all in. Setting stop-loss below the key support by a certain margin is key to controlling risk.
Subsequent strategy:
If successfully breaking through and stabilizing at 2520: Opens up upside space, consider adding positions or holding for a rise, targeting the next resistance level.
If it continues to fluctuate below 2520 but holds the support: Pay attention to operational opportunities at the edge of the fluctuation range, or patiently hold bottom long positions, maintaining risk control.
If effectively breaking below the key support: Respect the market, strictly enforce stop-loss discipline, protect profits and principal. Wait for new stabilization signals or adjustment end signals before considering replenishing.

Friends, did ETH's performance last night make your palms sweat? Share your great operations, and I, Jin, will randomly select three of the highest liked comments to send an ETH technical analysis package! Don't hold back; the market relies on everyone's support.
$ETH
Twelve years of financial journey, exclusive secrets of crypto pioneers: Insight into the market, steady progress, pay attention to how Jin Zhu teaches you to steadily increase value, where risks and opportunities coexist in investment. Blind operation is a big taboo in the crypto world!
#币安Alpha上新
