Shiba Inu price rose slightly today, June 25, aligning with the performance of the crypto market. SHIB trades at $0.00001175, up by 15% from its lowest point this week. Technicals point to a 52% surge despite the ongoing whale selling spree.
Shiba Inu Price Ripe for a Breakout as Double-Bottom Forms
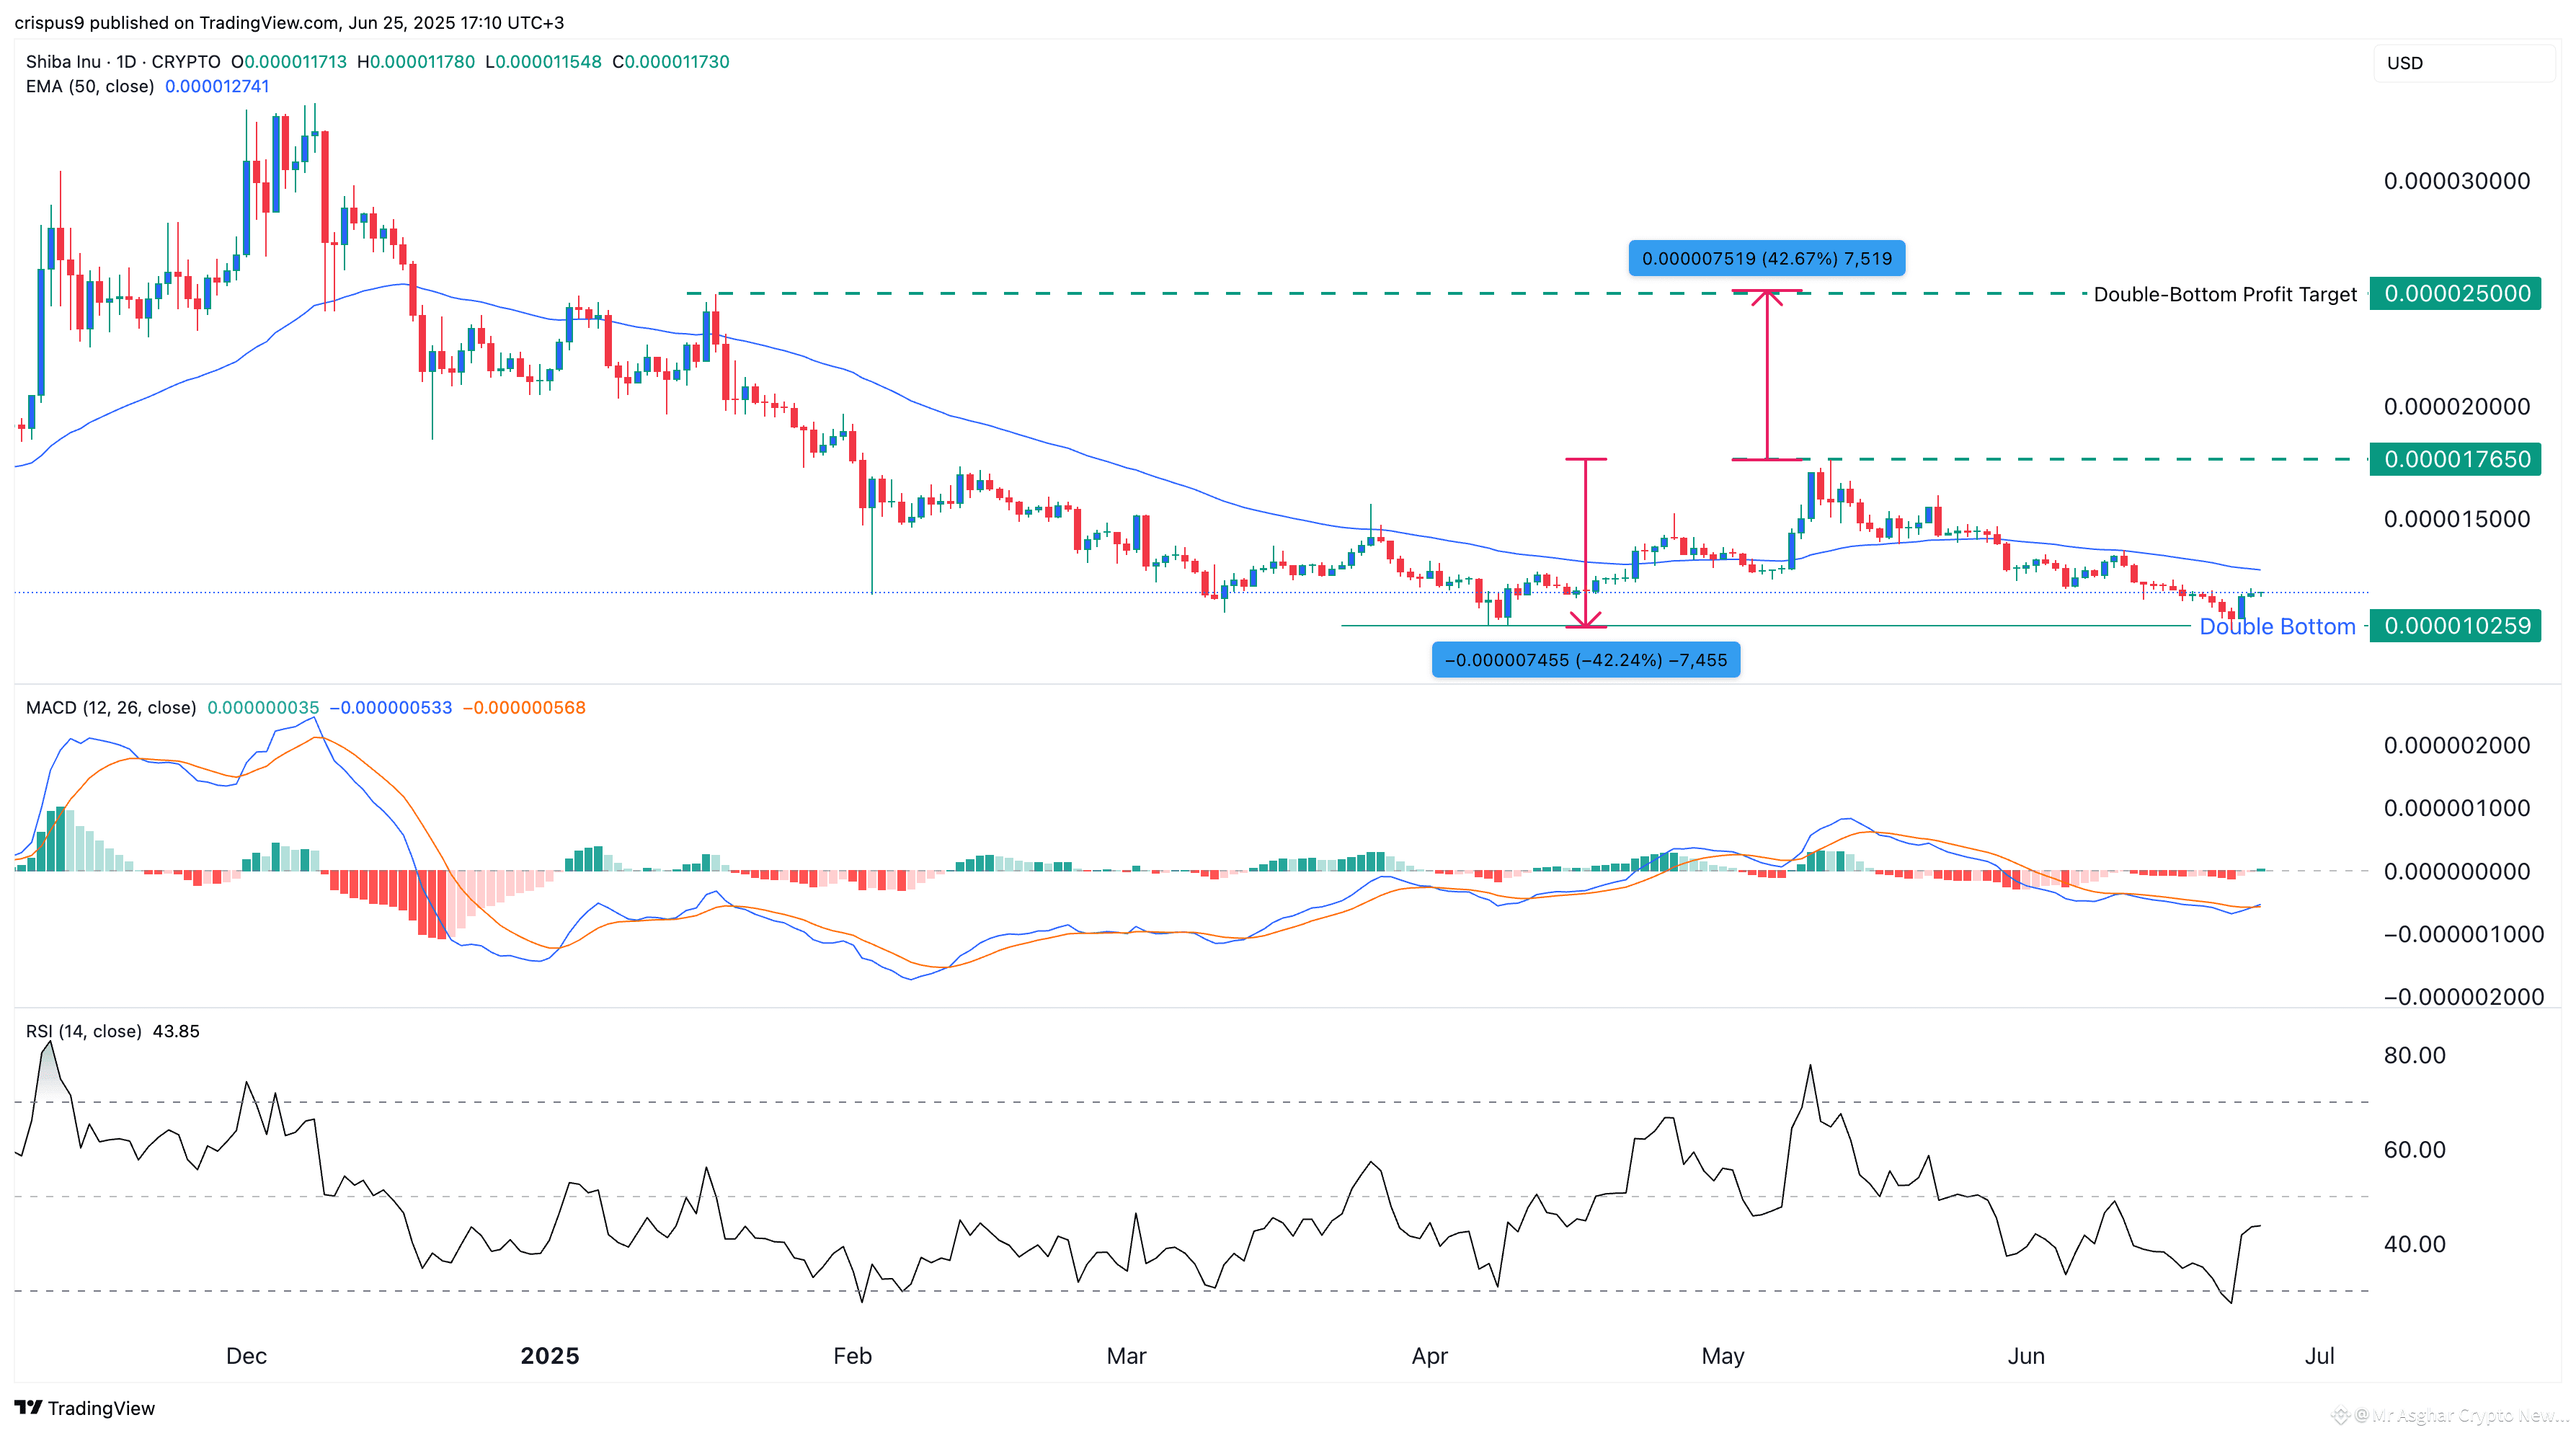
The daily chart timeframe shows that Shiba Inu price has been in a strong downtrend after peaking at $0.00001765 in May. It has dropped by 35% from that point to the current level of $0.00001172.
On the positive side, SHIB price has formed a double-bottom pattern at this week’s low of $0.00001025. This pattern is made up of two distinct lows, and a neckline, which, in this case is at $0.00001765.
A bullish breakout often follows a double-bottom pattern as long as the price remains above the lowest point. The price target in this pattern is estimated by measuring the height by subtracting the lowest point from the neckline. In this case, the height is $0.0000074.
The height is then added to the neckline, bringing the target price at $0.000025, which is 115% above the current level. The initial target will be the double-bottom neckline at $0.00001765, up by 52% from the current point.
Oscillators are showing bullish signals. The two lines of the MACD indicator have formed a bullish crossover, while the Relative Strength Index (RSI) has pointed upwards and is nearing the neutral point at 50.
The bullish Shiba Inu price forecast will become invalid if it drops below the double-bottom point at $0.00001025. Doing that will invalidate this pattern and point to more downside.
#shib #BTC110KToday? #MarketRebound #SaylorBTCPurchase #BinanceHODLerSAHARA $BTC $BNB $SHIB