The altcoin/BTC chart is now back to the lows of 2019 and 2020. In other words, altcoins have almost reached the historical bottom zone against Bitcoin Benjamin Cowen @intocryptoverse also shared a chart and said: “The altcoin market acts like an oscillator at best against Bitcoin. It keeps coming back and hitting the same places and then returning.” I think he is a good commentator Every cycle says “this time it’s different”, but the chart always tells the same story. This is the nature of this business: first $BTC shines, then there is the alt season that comes late, but it comes to those who are patient. Those who are not patient usually sell because “alts are dead”, and that is exactly the bottom. A further decline is possible, but the decline in this chart is possible even if altcoins remain stagnant and Bitcoin rises. If you think the cycle is different this time, if you say that only $btc will make money, if you believe in that, I respect that. This is also a strategy. Maybe you will be right, who knows... The chart is there, I did not draw it. The current level is the same as the previous lows. It may turn up again or stay there for a while, but these areas are usually either the beginning of a sub-season or a test of patience. This is not investment advice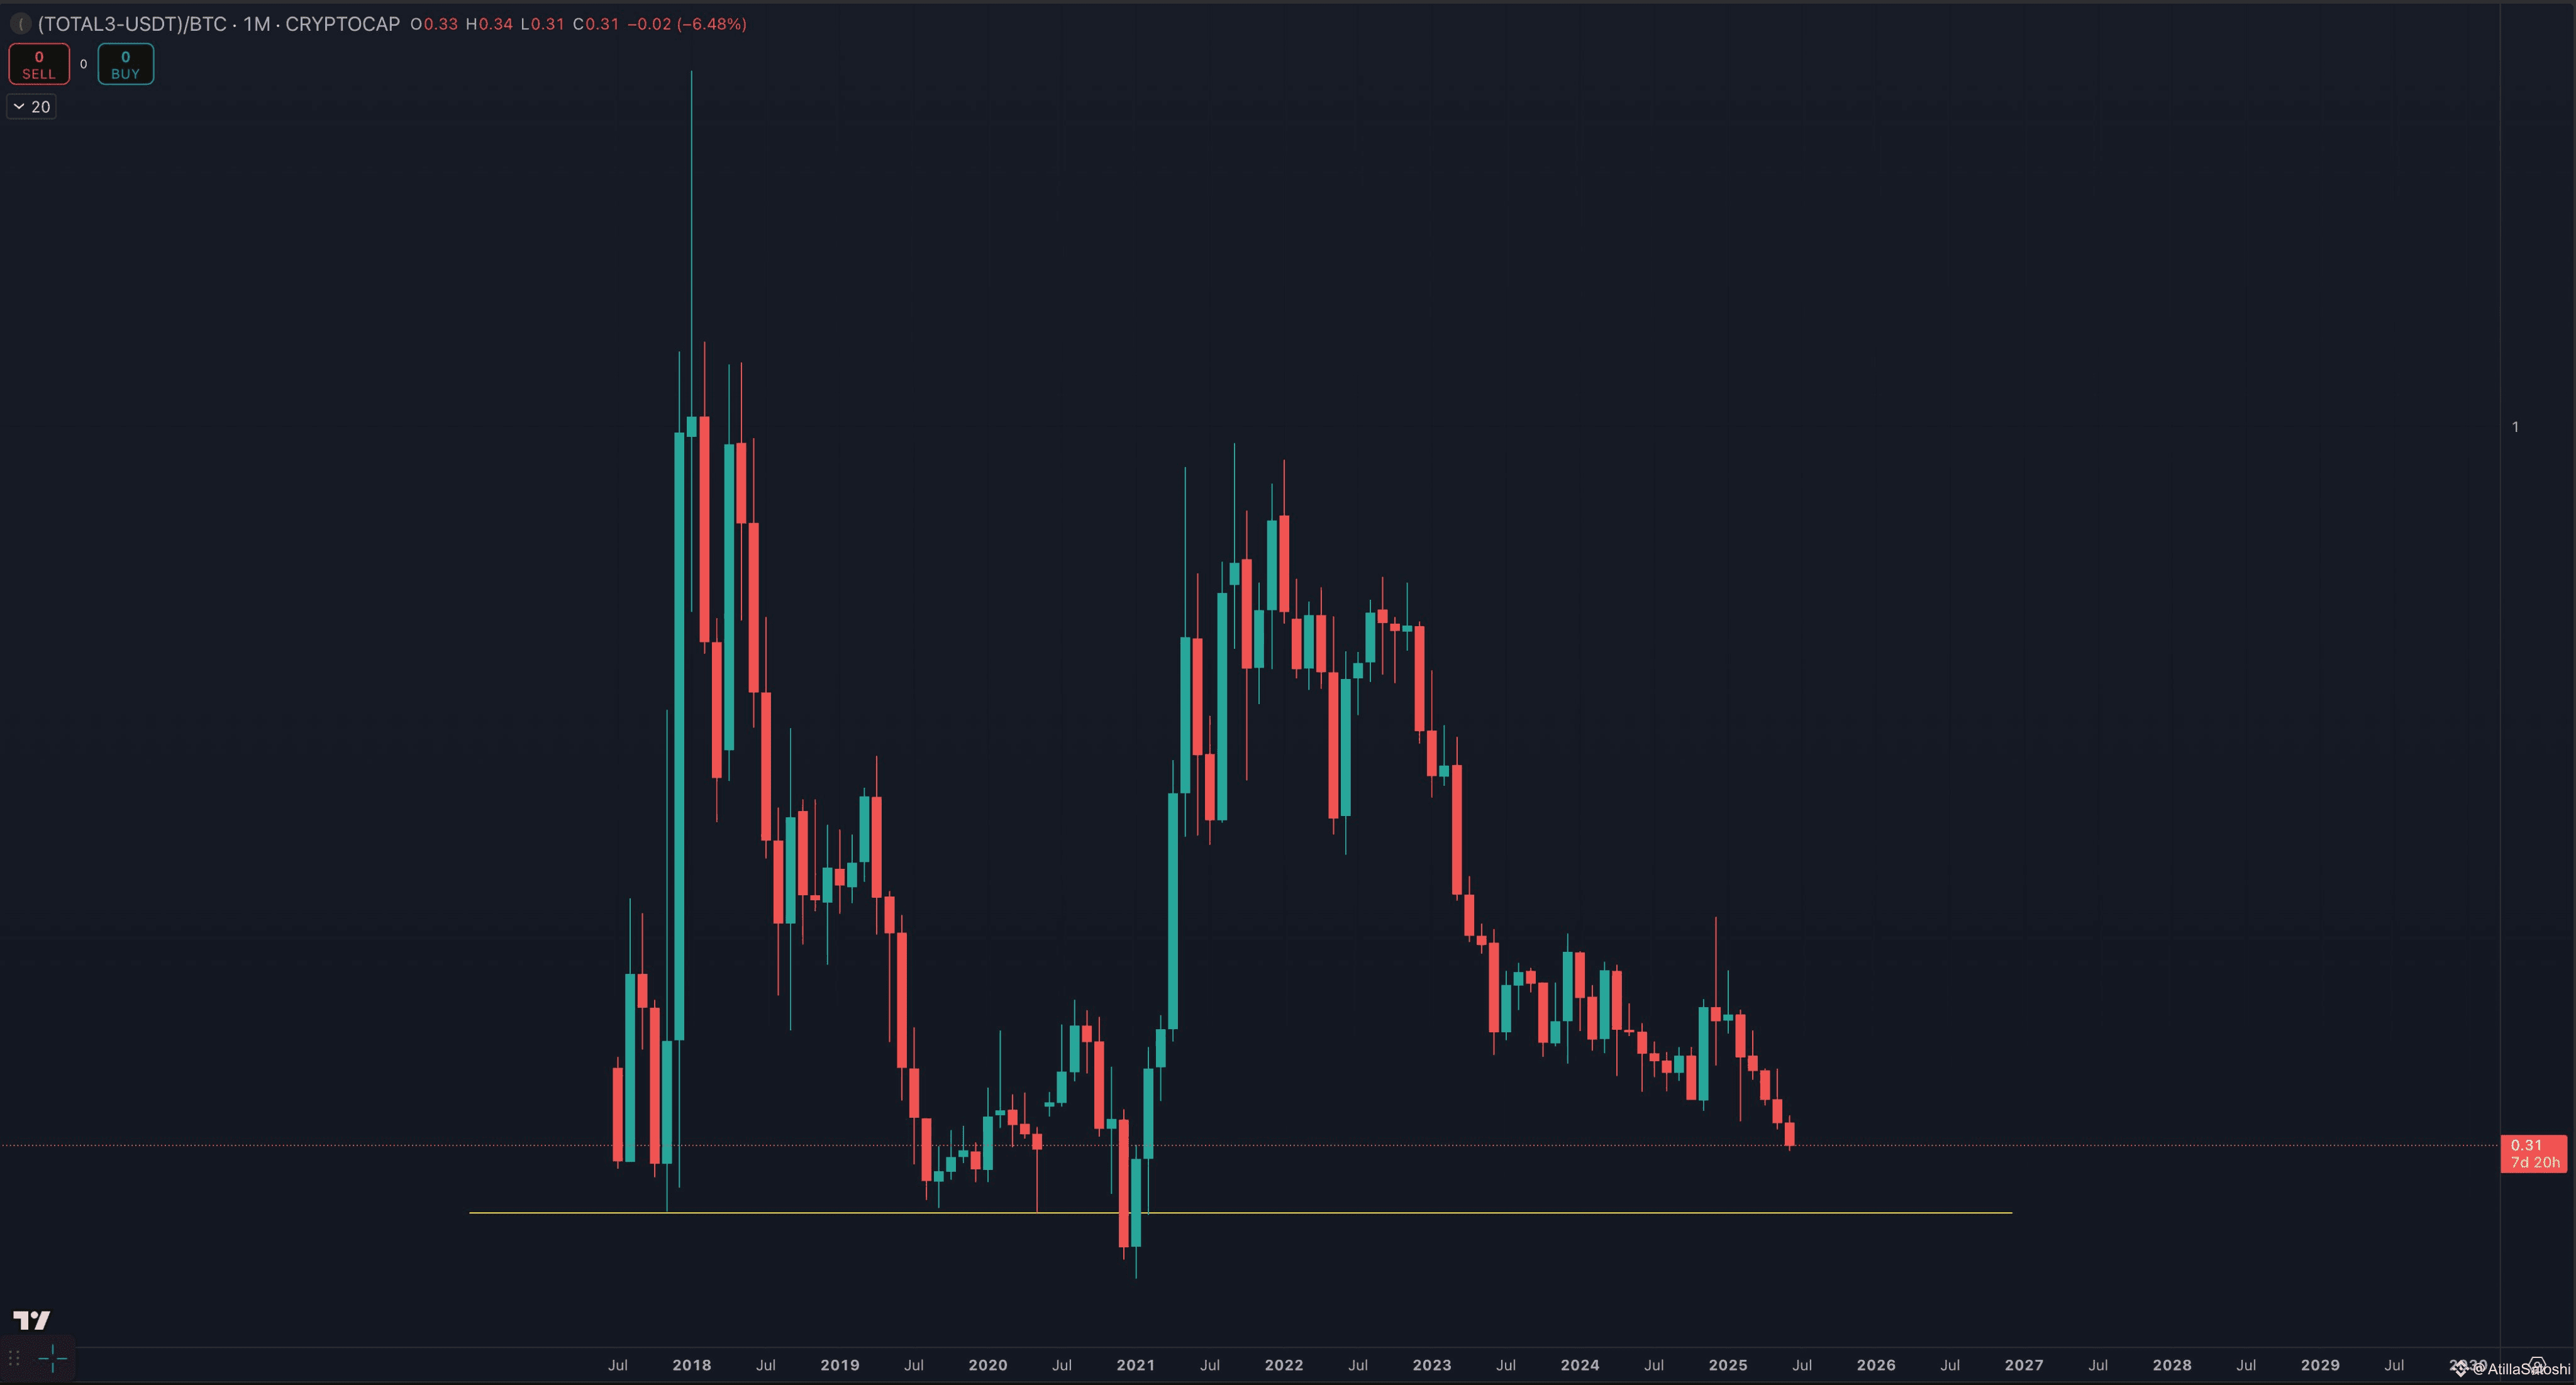
#MarketPullback #BinanceAlphaAlert #IsraelIranConflict #SaylorBTCPurchase #Bitcoin❗ $BTC
