

In this THREAD I will explain "Market Structure"
1. How to identify a trend
2. How to draw a chart from 0
3. How to trade between ranges
🧵(1/13)
1. How to Identify a trend
Market Structure will help you as a trader to spot BULLISH and BEARISH trends.
Bullish MS is a continuous series of HH (Higher High) and HL (Higher lows) on a trend.
Bearish MS is formed by LH (Lower high) and LL (Lower Low)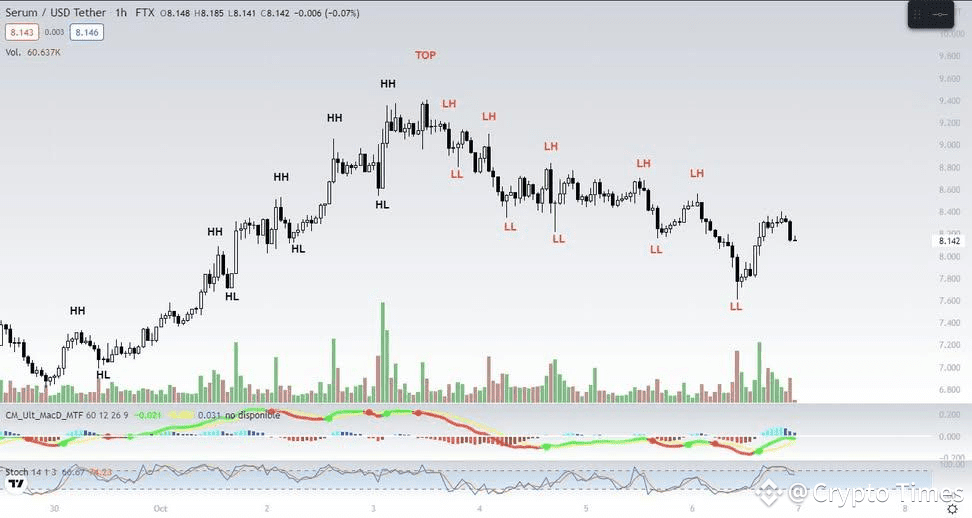
1.1 How to identify a trend
Bullish MS: is a succession of HH and HL
We can identify a BULLISH trend by watching 2 or more HH's on chart and HL
Bearish MS: is a succession of LH and LL
When we identify 2 or more LH and LL on chart, usually on a downtrend.

1.2 How to identify a trend
A sideways trend is the horizontal price movement that occurs when the forces of supply and demand are nearly equal.
This typically occurs during a period of consolidation before the price continues a prior trend or reverses into a new trend

1.3 How to identify a trend
Typically, there are three different types of trends:
Uptrend, Downtrend and Sideways trend.
Understand how and why every of this trends are created.
If you understand trends, you can trade any trend.

1.4 How to identify a trend
Some indicators are very useful for the identification of trends
Moving Average is often seen as support or resistance, not as straight lines, but as curves moving in time
Moving Averages identify when a trend is starting or finishing

1.5 How to identify a trend
Bollinger Bands are useful to identify trends.
Buying in an uptrend, if the price has tested the middle line from above.
Selling in a downtrend, if the price has tested the middle line from below.

2. How to chart from 0
Before you start drawing the Resistance and Support, always pay attention to the trend.
It's bearish or bullish?
Start drawing from the Lows to the Highs
It's easier to identify a bottom than a top.

2.1 How to chart from 0
In this chart we find a Bullish Price Action.
Draw the range where the price has been fluctuating.
Identify the start of the bullish trend and label it.
Identify HH and HL to know where the Highs and Lows are in the trend.
2.2 How to chart from 0
A chart from 0 has to be draw following this steps:
1. Identify the support. Identify your invalidation
2. Identify the possible resistance. Where the price must retrace
3. Identify the current trend in the chart.

3. How to trade between ranges
A trading range is the range between the high and low price of an asset within a given period
Breakouts and breakdowns are more reliable when they are accompanied by a large volume
In a trading range, Accumulation or Distribution is occurring

3.1 How to trade between the ranges
Buy at the bottom of the range, sell at the top
Place stops just beyond the edges
If price breaks below Support, flip to short; if it breaks above Resistance, flip to long
Watch for false breakouts at resistance. Also called Deviations.

Don't forget to follow me , thanks 👍