In the cryptocurrency market, the market changes rapidly, and how to accurately capture opportunities has become an important topic for traders. This article will take you to understand the 8 major technical analysis indicators in the crypto space in detail, explain their application methods and practical tips, helping you better identify market signals and improve your trading success rate.
Popularization of Technical Analysis Indicators in the Crypto Space
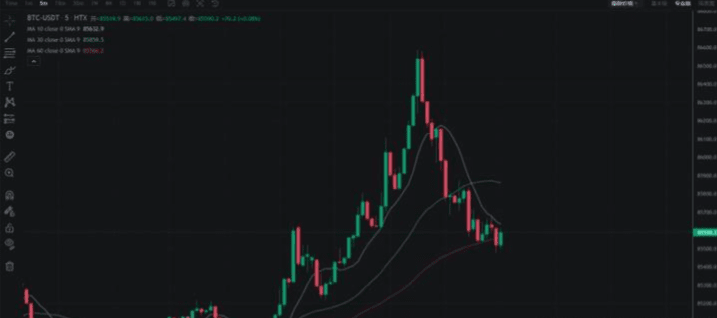
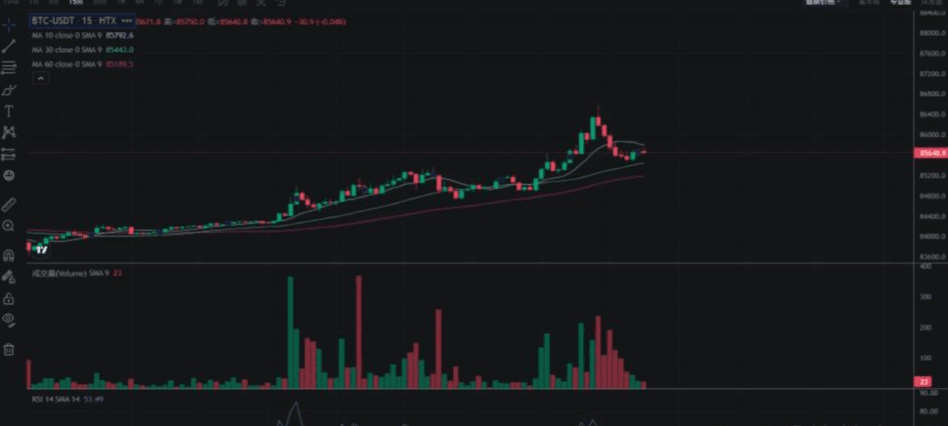
1. Moving Average (MA): A powerful tool for trend judgment
Definition: The moving average line smooths data fluctuations by calculating the average price over a period, helping you judge the overall market trend.
Application Tips:
Golden Cross: When the short-term moving average crosses above the long-term moving average, it is often regarded as a buy signal.
Death Cross: When the short-term moving average crosses below the long-term moving average, it may signal a selling opportunity.
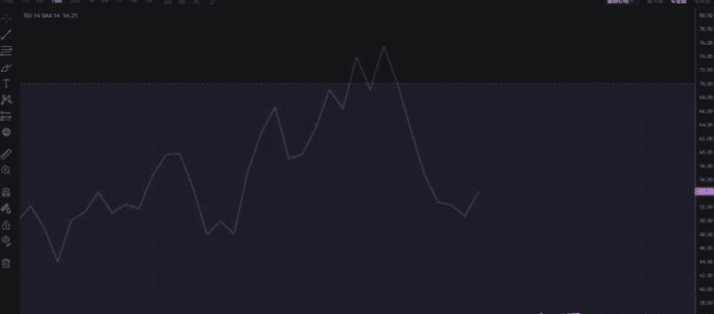
2. Relative Strength Index (RSI): Overbought and oversold signals
Definition: The RSI indicator measures the speed and magnitude of price movements, with a value range of 0 to 100.
Application Tips 5:
When RSI exceeds 70, it usually indicates that the market is overbought, increasing risk.
If RSI is below 30, it may indicate an oversold area, presenting a bottom-fishing opportunity.
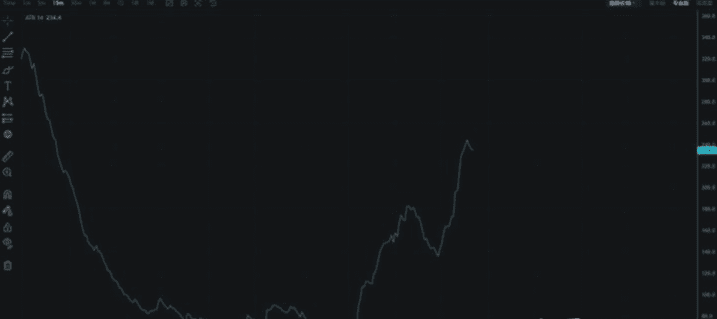
3. Average True Range (ATR): Volatility indicator
Definition: ATR is used to measure market volatility, with higher values indicating more severe fluctuations.
Application Tips:
It can help you set a reasonable stop-loss position, for example, setting the stop-loss at 1.5 times the current ATR to reduce risk.
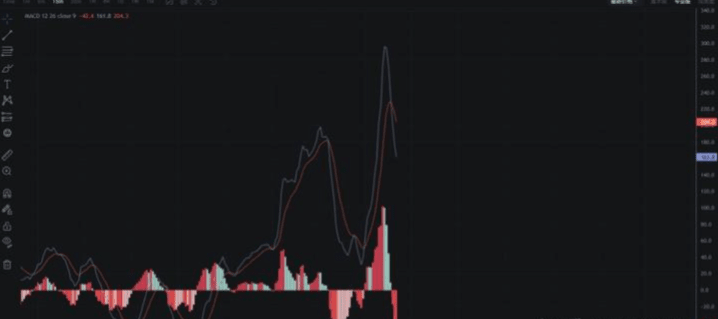
4. MACD Indicator: Dual verification of momentum and trend
Definition: MACD generates momentum signals by utilizing the difference between two Exponential Moving Averages (EMA).
Application Tips 5:
Crossover Signal: When the MACD line crosses above the signal line, it is a buy signal; conversely, it is a sell signal.
Histogram Changes: The expansion or contraction of the histogram helps to assess the strength of the trend.
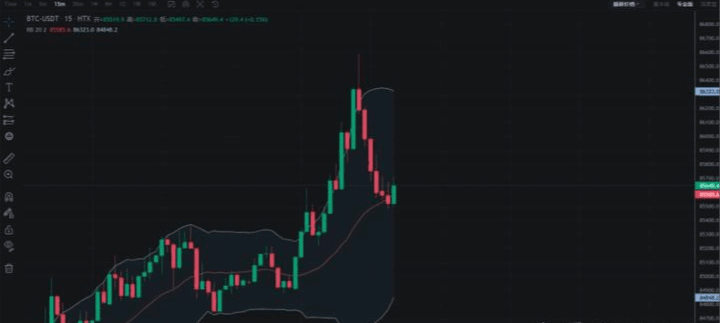
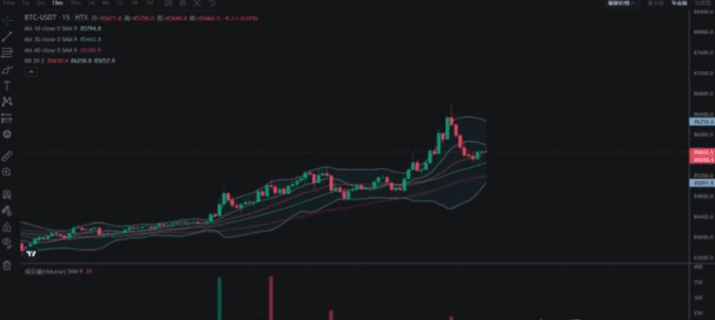
5. Bollinger Bands: Price volatility range
Definition: Bollinger Bands consist of a middle band (usually the 20-day SMA) and two standard deviation lines above and below.
Application Tips:
When the price touches the upper band, it may indicate overbought conditions, while the lower band may indicate oversold conditions.
The narrowing of the Bollinger Bands indicates that a significant market movement is about to occur, so stay alert.
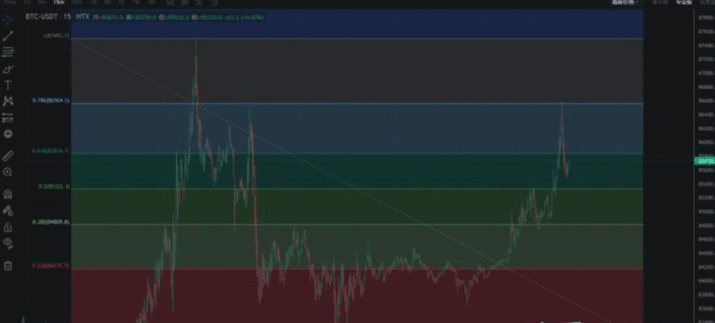
6. Fibonacci Retracement: Finding support and resistance
Definition: Based on the Fibonacci ratio (such as 0.382, 0.5, 0.618, etc.), it determines the support and resistance levels of price pullbacks.
Application Tips:
In an uptrend, a pullback to the 0.618 range may provide buying opportunities; in a downtrend, a rebound to the 0.382 range may form a sell signal.
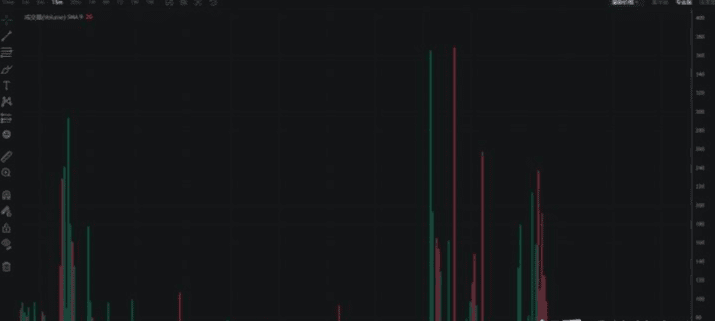
7. Volume Indicator: Key to verifying trends
Definition: Trading volume reflects market activity and is usually analyzed together with price trends.
Application Tips:
If the price rises and the trading volume increases, the trend is more reliable.
If the price rises but the trading volume shrinks, be cautious as the trend may reverse.
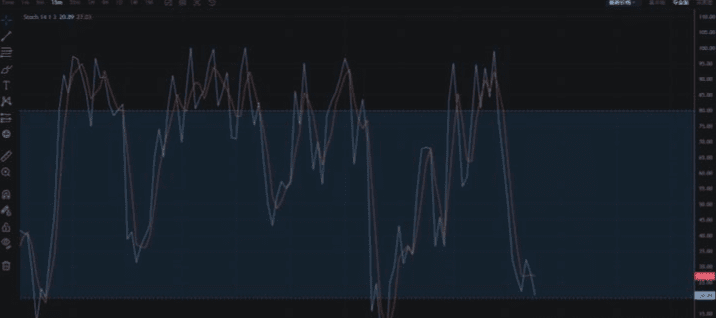
8. KD Indicator: Capture short-term buying and selling opportunities
Definition: The KD indicator uses the Stochastic Oscillator to assess price momentum.
Application Tips 5:
When the K-line crosses above the D-line: it is often a buy signal.
When the K-line crosses below the D-line: it may suggest a sell signal, suitable for short-term operations.
Practical Tips 5: Indicator combinations help you establish a foothold in the crypto space.
Single indicators often have limitations; it is recommended to combine multiple indicators in actual trading.
MA and RSI Combination: When the short-term moving average crosses above the long-term moving average and the RSI is not yet overbought, consider entering the market in the direction of the trend.
MACD and Bollinger Bands: MACD crossover signals combined with the narrowing of Bollinger Bands can help you capture entry opportunities before a market breakout.
Volume Verification: Regardless of the indicator used, trading volume is always an important basis for judging market continuity, and must be combined with observation.
Conclusion
Technical analysis is just a part of trading in the crypto space. Successful trading also requires continuous learning, practical summaries, and good risk management. I hope the major indicators and practical combinations introduced in this article can help you, and I also welcome everyone to communicate more and share their trading insights. I wish everyone can achieve steady profits and avoid detours in crypto trading!
I am the Royal Instructor, having experienced multiple bull and bear markets, with rich market experience in various financial fields. Follow my public account, and here, penetrate the fog of information to discover the real market. Seize more opportunities for wealth codes and discover truly valuable opportunities—don't miss out and regret it!
