

🔍 ANALYSIS #BTC /USDT
On the 6H chart of BTC/USDT, a large symmetrical triangle pattern is forming with successive touches of the lower and upper boundaries. This indicates consolidation, in anticipation of a breakout. The price is trading around $102,700 after another rebound from support.
📉 Key support zone: $98,261
📈 Resistances: $103,488 — $106,187 — $110,715 — $111,826
💡 The chart highlights a possible double touch of support with a ratio of 1.21 — a sign of a potential 'double bottom' pattern. Upon confirmation, the upward movement could reach a target of $111,826, suggesting a growth of about 9.1%.
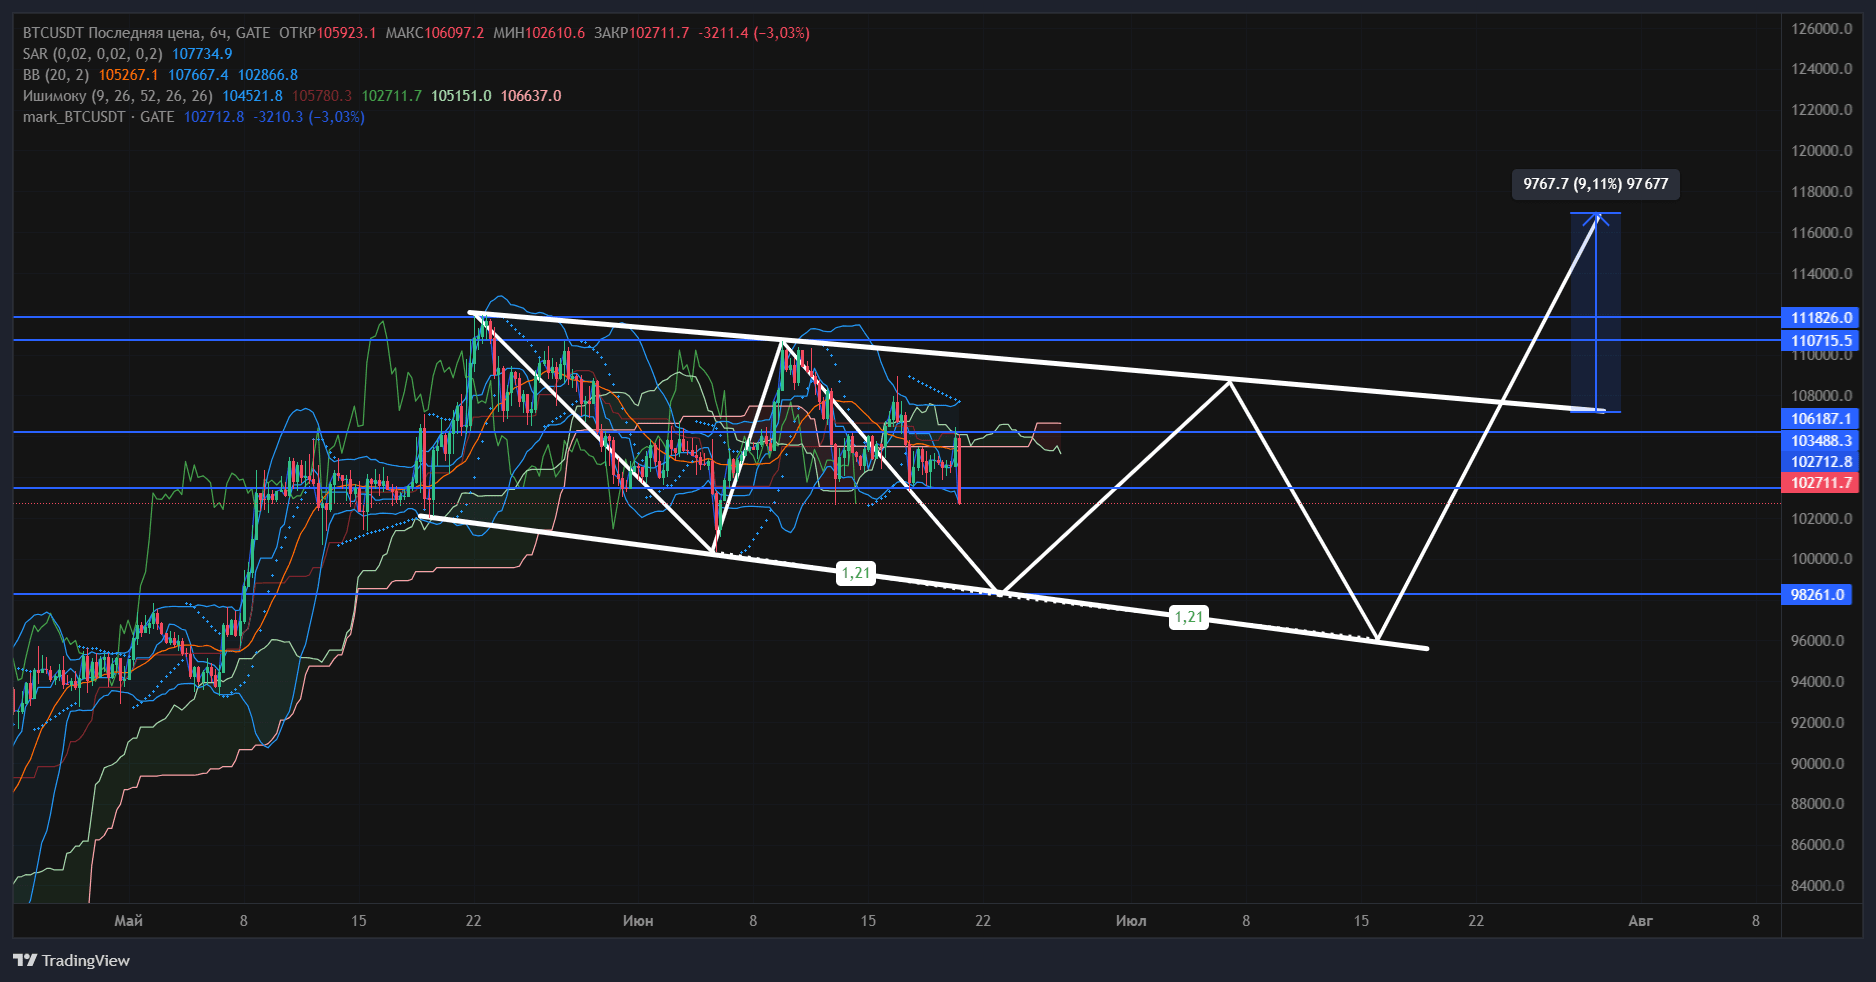
☁️ The Ichimoku cloud indicates uncertainty, but the price is near the edge of the cloud, and a breakout upwards could trigger growth.
📊 Indicators:
Bollinger Bands are narrowing, signaling the approach of a strong movement.
SAR indicates an upward momentum.
📌 Conclusion: Bitcoin is consolidating in anticipation of a decisive movement. A breakout above $106,187 will open the way to $111,826. At the same time, a break below $98,261 could send the price to review lower levels. Let's monitor the reaction in the support zone and the volumes!
#IsraelIranConflict #PowellRemarks On the 6H chart of BTC/USDT, a large symmetrical triangle pattern is forming with successive touches of the lower and upper boundaries. This indicates consolidation, in anticipation of a breakout. The price is trading around $102,700 after another rebound from support.#DAOBaseAIBinanceTGE