
XRP (XRP) has been consolidating in a tight range from $2.05 to $2.33 over the past 30 days as the $3 mark remains elusive. Key data points explain why XRP's price is stuck in consolidation, including declining network activity of the XRP Ledger, decreasing open interest, and weak technical factors.
XRP Ledger Network Activity is Declining
The XRP Ledger has seen a significant decline in network activity over the past six months. Onchain data from Glassnode shows that daily new addresses on the network are significantly lower than the 2025 peak of 15,823 reached on January 16. Only 3,500 new addresses were created on Thursday.

Similarly, the number of daily active addresses (DAA) on the network has plummeted to 34,360 on Thursday from a three-month high of 577,000 on Saturday, signaling a decrease in interest or a lack of confidence in XRP's short-term outlook.

Traditionally, a decline in network activity often signals impending stagnation or price declines, as lower trading volumes reduce liquidity and buying momentum.
Declining OI Reflects XRP Price Stagnation
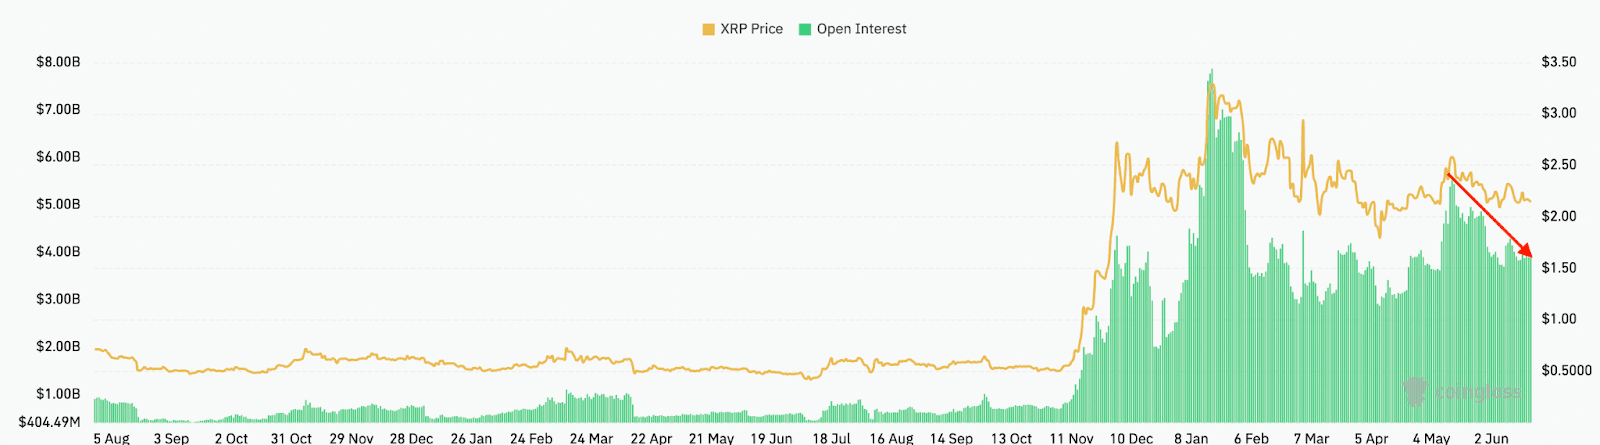
According to data from CoinGlass, XRP's inability to reach the $3 mark is further reinforced by the decline in open interest (OI).
The chart below shows that XRP's OI has decreased by 30% from $5.53 billion to $3.89 billion, indicating that investors are closing positions with the expectation that XRP prices will decline.
Historically, significant drops in OI have preceded declines in XRP prices. For example, the current scenario reflects the drop in XRP prices in January, leading to a 53% decrease to a multi-month low of $1.61 on April 7 from a multi-year high of $3.40 in January.
XRP Price Held Back by Moving Average
Data from Cointelegraph Markets Pro and TradingView shows XRP price is stuck below the key resistance zone between $2.22 and $2.40. This is where all the major simple moving averages (SMA) currently lie.
If XRP buyers do not push the price above the SMA, this altcoin may consolidate below these trendlines for a few more weeks. Each time the price of XRP breaks below these trendlines, it trades sideways for 30 and 65 days before sweeping through lower levels before breaking out upwards, as shown in the chart below.

"XRP price continues to struggle at $2.25," XRP trader and analyst CasiTrades said in a post on X on Wednesday, adding:
"As long as this resistance level remains, the likelihood that we will break lower increases: $2.01, $1.90, even $1.55 remains possible."
This aligns with the descending triangle analysis, indicating a potential drop of 45% to $1.20 if the support at $2.00 is lost.

The RSI index has dropped to 51 from an overbought level of 81 on January 20, indicating increasing bearish momentum. Additionally, the price of XRP falling below $3 over 200 days could be a precursor to a strong rally up to $10, similar to the previous strong rally in 2017.
