The cryptocurrency market finds itself at a crossroads as global financial markets shake due to geopolitical tensions. Major cryptocurrencies barely moved today, with Bitcoin, Ethereum, and XRP all stable in the long term - according to cryptocurrency standards, anyway.
The total market capitalization of cryptocurrencies is $3.58 trillion, a level close to yesterday's. Bitcoin struggles to stay above the $104,000 level again, which is close to yesterday's level. XRP is trading at $2.14, while Ethereum is slightly above $2,500 - both in the green, but barely.
In the bigger picture, the Israeli-Iranian conflict has led to a 7% rise in oil prices, with Brent crude touching $78, while traditional safe havens like gold are seeing renewed interest. The S&P 500 hovers just below the 6000-point level, reflecting broader market uncertainty as investors grapple with inflation concerns and policy decisions made by the Federal Reserve alongside escalating tensions in the Middle East.
But there are at least two coins making a significant move today: one towards the moon, and the other towards the ground.
$Fartcoin : The meme coin frenzy tests reality
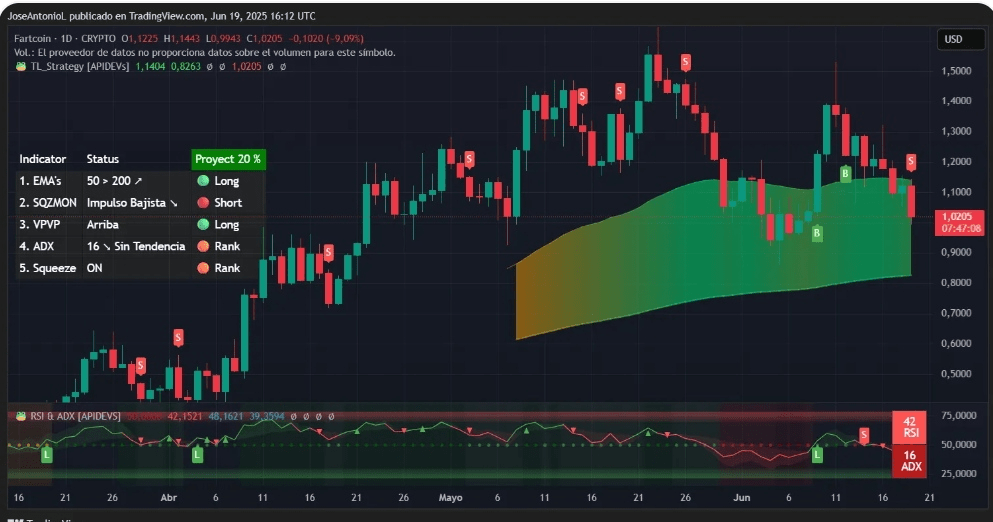
Trading data $FARTCOIN .
Fartcoin has become a favorite among meme coin traders. First, because it’s funny and memes are traded for excitement. On the other hand, the Solana-based coin has been on what seems to be an unstoppable upward trajectory with 'prices rising'. Today, however, the excitement has diminished.
The 9.7% drop in Fartcoin today embodies the volatile nature of meme coin trading. The listing on Binance.US contributed to the excitement among traders, driving trading volume up by 66% to $373 million, but reality quickly took over the market as profit-taking emerged. The 'sell on news' pattern is a typical reaction expected by experienced traders.
The Relative Strength Index (RSI) for $Fartcoin is at 42, nearing the oversold territory. This measure assesses momentum by comparing recent gains to losses, with readings below 50 indicating increasing downward pressure. When the RSI falls below 50, it often suggests that sellers are in control of the market, reducing the likelihood of short-term rebounds.
The average directional index (ADX) for the coin is 16, indicating that the previous long-term uptrend is losing its strength and is now weak. The ADX measures the strength of price trends regardless of direction. Readings below 25 indicate that the market lacks certainty, meaning traders should expect volatile movements without a clear direction instead of sustained moves.
The exponential moving averages for Fartcoin indicate a downward trend: the coin is trading below the 50-day exponential moving average ($1.21) and approaching the 200-day exponential moving average ($1.02). When the price falls below these key moving averages, it usually indicates that the short-term trend has shifted to negative, and traders often use these levels as dynamic resistance points to sell the rallies. However, the short-term exponential moving average is still well above the long-term exponential moving average, which remains a good indicator for long-term traders, as the likelihood of a negative crossover (when the 50-day exponential moving average falls below the 200-day exponential moving average, meaning the average price of the coin previously was much higher than its current buying price) is still not strong. Key levels:
Immediate support: $0.92-$0.95 (Fibonacci retracement 78.6%)
Strong support: $0.89 (lowest level in May 2025)
Immediate resistance: $1.20-$1.21 (previous support turned into resistance)
Strong resistance: $1.28-$1.30 (last rejection area)

If Fartcoin is causing cries of discontent from financially affected individuals, the astonishing 13.5% rise of O, K, B coin brings joy to its holders. The O, K, X coin of the cryptocurrency trading platform rose to $54.70 before a slight correction to its current price of $52.87, which is enough for a 9.87% increase during the day.
The twenty-eighth burn of the O, K, X coin removed 42.4 million O, K, B coins from circulation, representing 20% of the circulating supply, a move that typically causes immediate scarcity and drives prices up as the value of the remaining coins increases.
In fact, the Relative Strength Index (RSI) reading for O,K,B at 55.26 shows neutral to bullish momentum, not a state of overselling. This indicates that O,K,B has already recovered from oversold levels and is now in a more healthy zone above 50, which typically suggests bullish momentum when paired with a price above major exponential averages. However, this movement is likely event-driven, so traders will want to wait and see if the trend continues after everyone has sold the news.
The A,DX index at 17 shows that the previous downtrend is losing momentum. This, along with the oversold rebound, indicates a potential trend reversal, although experienced traders and technical analysts will wait for the A,DX index to rise above 25 to confirm the formation of a new bullish trend.
Price behavior shows O,KB recovering the Fibonacci retracement level of 23.6% at $52.81 - these levels form natural support and resistance based on mathematical ratios widely observed by traders. A breakout of this level with high trading volume indicates buyers regaining control. The stock also surpassed the 50-day exponential moving average, confirming this theory.
But as always, it is impossible to say whether this movement is merely a reaction to important news or a natural correction that will maintain momentum over time.
Key levels:
Immediate support: $51.60 (50-day exponential moving average)
Strong support: $49-$50 (psychological level)
Immediate and stronger resistance: $56 (May swing high)
Disclaimer
The opinions and views expressed by the author are for informational purposes only and should not be considered financial or investment advice.


