

Crypto analyst Crypto Sat has cautioned a “key reversal signal” on the 2-hour chart, noting that the recent deep correction may not prevail into the near-term Dogecoin price outlook.
This comes as the meme coin retests the key historic support zone that marked the mid-April market bottom. Since a local top in mid-May, a 30% drop has put this level back in question.
2-Hour Chart Could Soon Flip the Scales
According to analysis shared by Crypto Sat on X, Dogecoin is showing signs of accumulation following its sharp correction, with a potential double bottom pattern forming on the 2-hour chart.
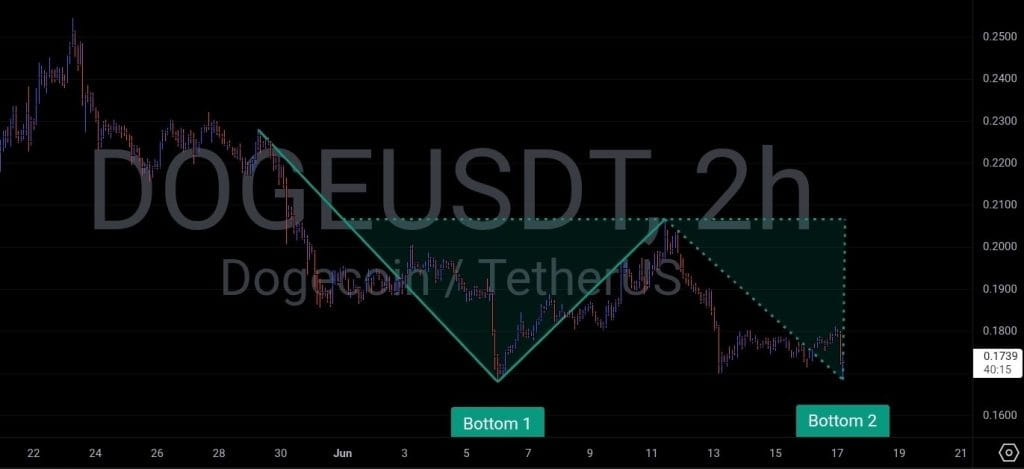
DOGE / USDT 2-hour chart, double bottom pattern. Source: X, @cryptosatred.
This classic reversal pattern could signal a local bottom and pave the way for a bullish continuation, provided key technical levels hold.
The first bottom formed around $0.168, where buyers stepped in to defend support following a sharp selloff.
A second bounce here—accompanied by supporting volume—would be an “early bull sign,” though the key focus is placed at the $0.20 neckline resistance.
The neckline could “decide the next big move”—a break above it would confirm the pattern and signal a sentiment shift favoring bulls.
That said, a lower low below $0.165 could suggest increasing bearish pressure as buyers fail to defend the once strong support.
Dogecoin Price Analysis: How This Ties into the Bigger Picture
Zooming out, the $0.168 level aligns with a historically critical support zone, repeatedly marking local bottoms since mid-2024—the most recent being the mid-April market reversal.
This support crosses a descending channel, forming the handle of a wider 4-year cup-and-handle pattern—a potential confluence zone for a breakout setup.

DOGE / USDT 1-week chart, cup-and-handle confluence zone. Source: TradingView, Binance.
A confirmed breakout would set a technical target around $0.75—a staggering 345% gain from current levels in line with the 1.618 Fibonacci extension.
However, this bullish case only holds if the $0.168 support level is maintained, and momentum indicators are flashing caution.
The golden cross from May has proven to be short-lived as the MACD line widens its gap below the signal line after a death cross to start June—a sign of a prevailing longer-term downtrend.
The RSI also lends to weakening buy pressure, continuing its decline below the neutral line to its current position at 42.
Below $0.168 lies a dangerous “gap area”—a price range with sparse previous buying activity, creating little historical support to limit downside.
If lost, the next major support zone sits around 47% lower at $0.90, last tested during mid-2024.
From there, all eyes turn to the June 15 US spot Dogecoin ETF decision, as a potential external catalyst, opening the doors to demand from traditional investment markets if approved.


