
Key Takeaways:
XRP has traded within a $1.90–$2.90 range for nearly 200 days, forming a symmetrical triangle on higher timeframes.
Technical analysts cite fractals from XRP’s 2017 rally that suggest a potential breakout to $3.70–$10 or even $25.
A bearish “inverse cup-and-handle” pattern could invalidate the bullish setup and drag XRP to $1.33.
XRP Trapped in 200-Day Sideways Channel — Breakout or Breakdown?
XRP has entered its 200th day of consolidation within a broad $1.90 to $2.90 price range, with little directional bias as bulls and bears remain evenly matched. The move follows XRP’s parabolic rally in November 2024, when the token surged nearly 500%, setting off a prolonged period of sideways trading.
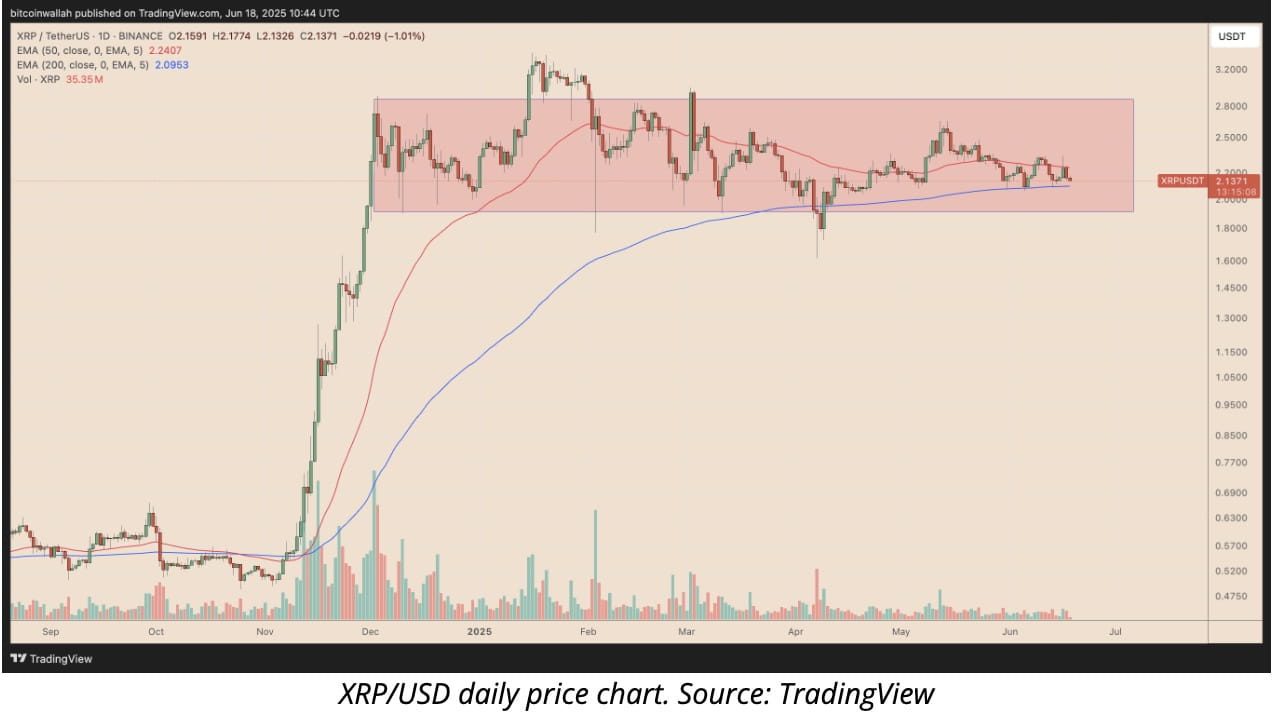
Despite repeated attempts, XRP/USD has failed to decisively breach either the upper or lower bounds of this range. The ongoing tight consolidation reflects market indecision, but analysts say the chart structure could soon resolve — and potentially trigger a significant move.
Bullish Fractals Hint at $3.70 to $10 Breakout
Analysts see similarities between XRP’s current setup and its historic 2017 bull run, which took the token from under $0.30 to over $3.00 in a matter of months.

Crypto analyst Mikybull Crypto noted that XRP’s present structure — a symmetrical triangle on the three-week chart — mirrors the pre-rally setup from 2017. If the pattern repeats, XRP could see an “epic breakout” toward $3.70 or higher, marking a 75% gain from current levels around $2.14.
“Symmetrical triangles are neutral consolidation patterns, but in bull markets, they often resolve upward,” Mikybull said.
Analyst XRPunkie also echoed the sentiment, noting that momentum is building around the apex of the triangle, with breakout targets between $3.70 and $4.00.
Seven-Year Fractal Signals XRP Could Hit $10
Longer-term projections are even more optimistic. According to GalaxyBTC, XRP may be on the verge of repeating its multi-year breakout pattern from 2014–2017, which ended in a 1,300% price explosion.
“XRP’s current consolidation has lasted over 2,470 days — much longer than the 1,267 days in the last cycle — and the breakout structure is nearly identical,” GalaxyBTC noted.
If XRP mimics that breakout path from the recent $0.63 base, the next top could lie between $8 and $10.

Some traders have set even more ambitious targets between $20 and $27, using Fibonacci extensions and speculation around the approval of a spot XRP ETF as fundamental catalysts.
But Bears See $1.33 Breakdown If Trend Reverses
Despite bullish projections, downside risks remain. XRP’s weekly chart may also be forming an inverse cup-and-handle, a bearish reversal pattern that has historically preceded sharp corrections.
This setup suggests that XRP’s failure to hold above $2.20–$2.30 could trigger a decline toward $1.33, aligning with the 0.382 Fibonacci retracement level that previously acted as resistance during XRP’s 2021 correction.

A breakdown below $1.90 with high volume would confirm the pattern and invalidate near-term bullish setups, technical analysts warn.
XRP at a Critical Juncture
With XRP trading at $2.14 at press time, the token sits near the midpoint of its consolidation range, with both bullish and bearish scenarios in play. Key indicators such as volume trends, breakout direction from the symmetrical triangle, and macro sentiment around crypto ETFs will likely determine XRP’s next major move.

For now, traders are watching the $2.90 resistance and $1.90 support levels closely — a break on either side could define XRP’s path into Q3 2025, according to Cointelegraph.
