Ex. Chart BTC (BITCOIN) that I mean is as a reference from/to the historical graph with an Interval Gap Value lasting 1 Hour (1 hour) [Comparison Between June 18, 2025 & June 12, 2024] Additionally, the screens being compared are also from April & January 2025 back to October including June 2024 (*as the intended Target).
The purpose is to adjust/get the cumulative price difference rising against Buy and conversely if the chart experiences a decline to BEARISH (low).
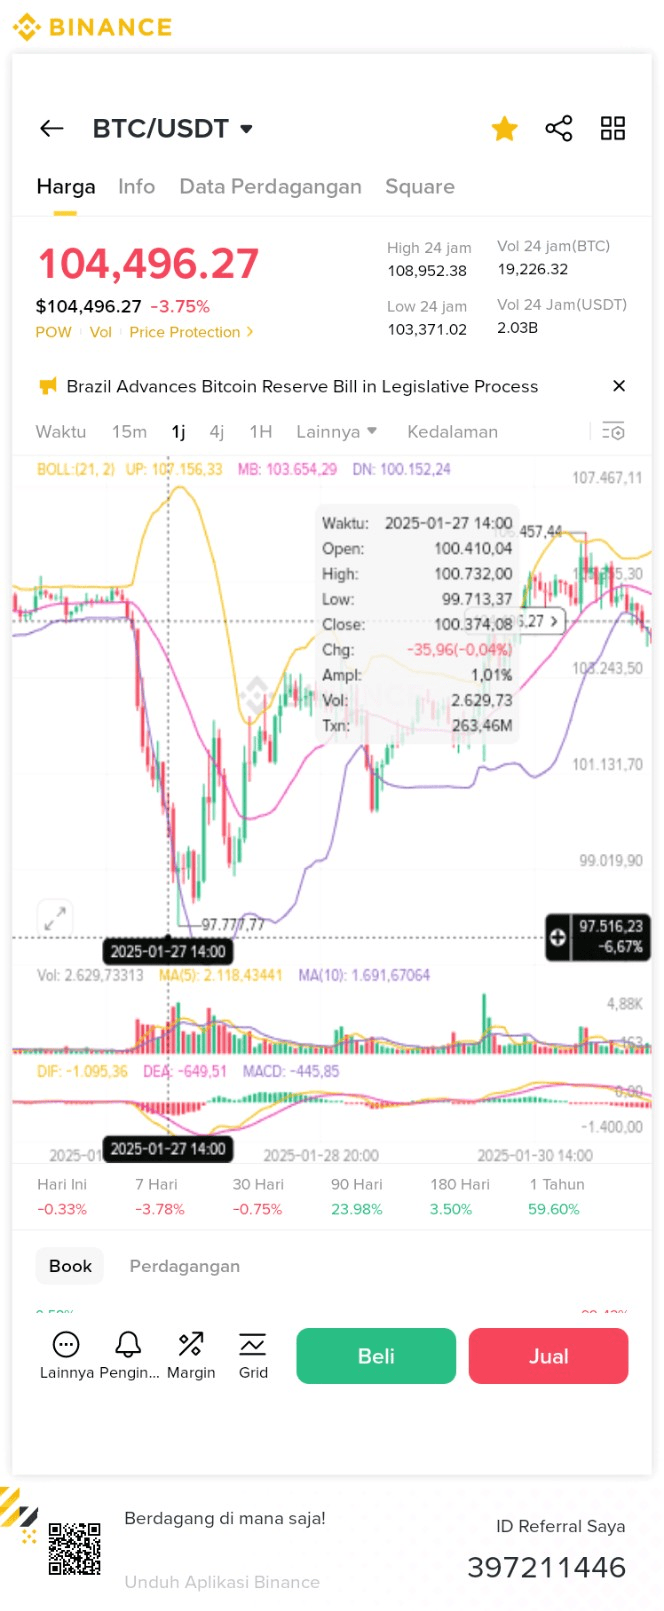
Here are some graphs through screen captures from the Samsung A12 media that I use.
🟩🟩🟩🟩🟩🟩🟩🟩🟩🟩🟩🟩🟩🟩🟩🟩🟩🟩
†EXISTING CHART (June 18, 2025)

Then continued with the capture image of the time comparison according to the chart category 📈 📉 (existing above)
1. EX CHART BTC AT 101,914.75 (June 6, 2025)

2. EX CHART BTC AT 83,900.00 (April 16, 2025)

3. EX CHART BTC AT 100,410.05 (January 27, 2025)
4. EX CHART BTC AT 52,888.00 (October 9, 2024)

5. EX CHART BTC AT 66,244.48 (June 12, 2024)

To ensure whether this Comparison will be effective at the actual time if the time interval needs can reach the maximum screen limit, then several conclusions will be presented as a reference for correlation for future time periods. It is hoped that it can be summarized as soon as possible in the next article. Thank you.
