This move indicates the long-term confidence of major buyers in Ethereum's stability.
Ethereum (ETH) is currently trading around $2,540, linked to a large purchase: a crypto whale acquired 48,825 ETH worth $127 million at an average price of about $2,605.
This thoughtful deal amid a recent downturn caused by geopolitical tensions and options expiration speaks of the long-term confidence of major players.
Interestingly, this investor has previously made $30 million on Ethereum, indicating an analytics-based strategy.
Cryptomarkets have declined following heightened tensions in the Middle East, impacting risk assets.
ETH has fallen nearly 0.75% in the last 24 hours, reaching $2,524 – amid the expiration of over 242,000 ETH in Deribit options, which increased volatility.
The put/call ratio stands at 1.20, and the maximum pain level is around $2,700, indicating a predominance of 'bearish' expectations. However, the whale purchase counteracts this and improves market sentiment.
Technical analysis of Ethereum: narrow range between moving averages.
The price forecast for Ethereum remains neutral as the asset consolidates in an important zone between 23.6% Fibonacci ($2,518) and the declining 50-period EMA ($2,580) on the 2-hour chart.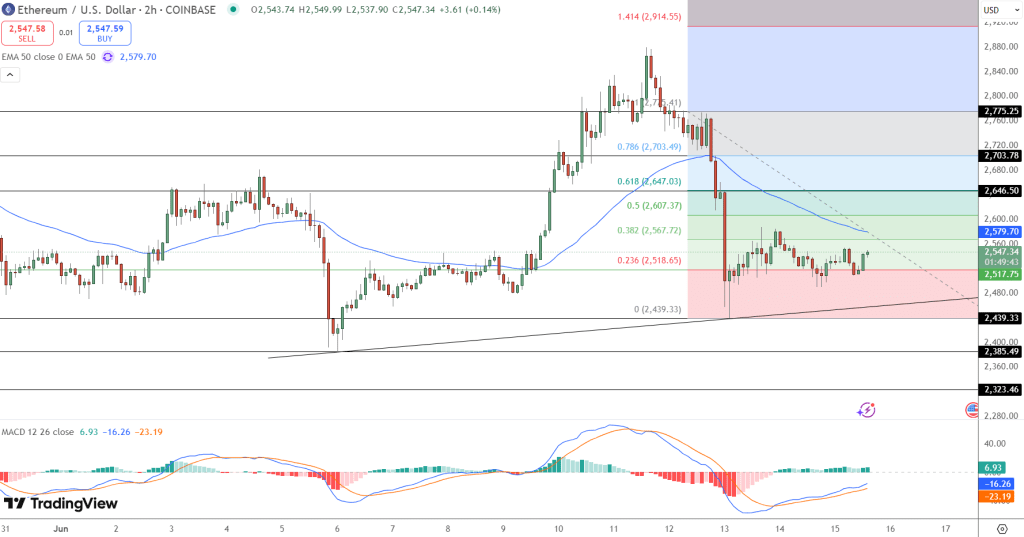
The appearance of a doji candle near the Fibonacci level indicates indecision in the market. Although ETH broke the ascending wedge (triggering a wave of selling), momentum indicators are starting to turn:
● MACD is approaching a bullish crossover
● RSI has dropped to 29, indicating oversold conditions
● No characteristic bearish formations, such as 'three black crows'
ETH is trading below its 20-, 50-, and 100-day EMAs, but there is potential for a bounce if the price consolidates in the $2,550–$2,580 range.
If this does not happen, the price may drop to $2,440, possibly even $2,300. In the event of buyer activation, targets may be revised upward.
Trading plan for Ethereum: balance between risk and profit.
Bullish scenario (buying on the dip):
Entry: consolidation above the Fibonacci level of 38.2% (~$2,568) and 50 EMA
Stop-loss: just below the current low (~$2,500)
Targets: $2,607 (50% Fibonacci), then $2,647 (61.8%)
Bearish scenario (playing for a breakdown):
Entry: breakdown of support and consolidation below $2,518
Stop-loss: above $2,540
Target: $2,440, with increased pressure — $2,300
Such a balanced plan allows for risk management and catching the trend in the right direction.
Bullish scenario (buying on the dip):
Entry: consolidation above the Fibonacci level of 38.2% (~$2,568) and 50 EMA
Stop-loss: just below the current low (~$2,500)
Targets: $2,607 (50% Fibonacci), then $2,647 (61.8%).
Bearish scenario (playing for a breakdown):
Entry: breakdown of support and consolidation below $2,518
Stop-loss: above $2,540
Target: $2,440, with increased pressure — $2,300
Such a balanced plan allows for risk management and catching the trend in the right direction.
Final conclusion:
Ethereum is at a key point. Technical indicators show a slowdown in the decline, while a large whale purchase indicates long-term interest.
A breakout above $2,580 may pave the way to $2,650–$2,700.
However, if the current support does not hold, a decline to $2,440 is likely. It's important to closely monitor these levels and manage risks wisely.
