As the cryptocurrency market strives to recover from last week's turmoil, the price of Dogecoin (DOGE) continues to decline. In contrast, Bitcoin (BTC) has shown a pattern since May 23: significant declines on Thursdays or Fridays, gradually recovering over the weekend, and further rebounding on Mondays. The similar pattern for three consecutive weeks suggests that Monday might continue this trend, and Dogecoin may have an opportunity for recovery. However, as of now, its price trend remains bearish.

The bearish structure of Dogecoin is evident. According to the daily chart, the market structure is firmly bearish, with prices breaking below the 78.6% Fibonacci retracement level (based on the rebound in early May). Currently, the local low of $0.17 has accumulated significant liquidity, and prices may rebound after touching this level again. On-chain indicators show potential buying opportunities, but the continuous decline in On-Balance Volume (OBV) indicates that sellers are still dominant.
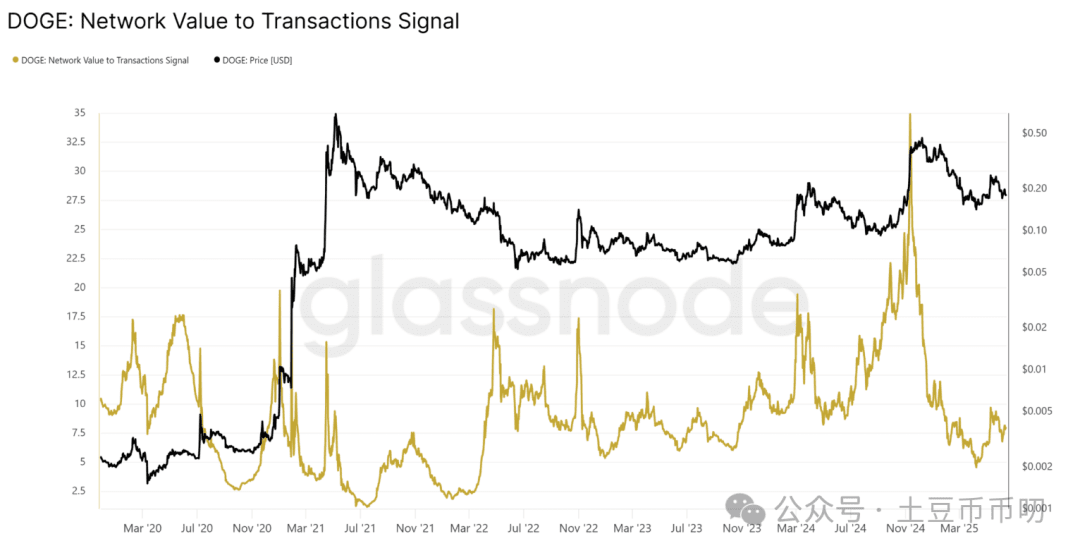
On-chain buying opportunities coexist with volatility risks. Network Value to Transaction Signal (NVTS) is an improved version of the NVT ratio, assessing the network utility of an asset through its market capitalization and 90-day moving average trading volume. Currently, NVTS is below the levels of May to June 2024, suggesting that Dogecoin is undervalued and may provide buying opportunities for investors.
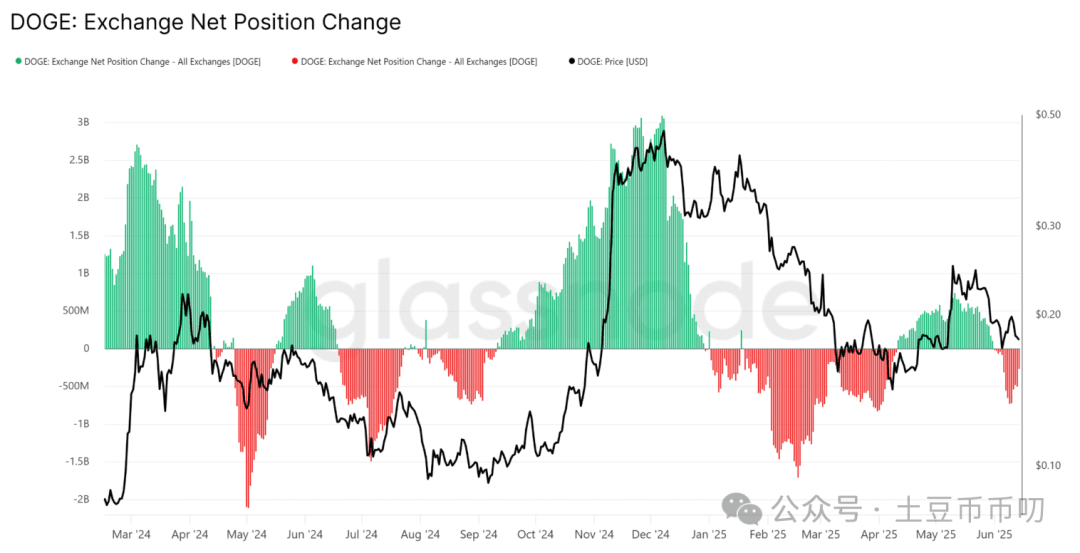
In addition, the net position change on the exchange turned negative in early June, indicating that Dogecoin is flowing out of exchanges, and the available supply of coins is decreasing, showing signs of accumulation. A similar situation occurred in January this year, but Dogecoin continued to decline for three months thereafter, indicating that a negative net position does not necessarily predict a rebound.
It is advisable to be cautious and observe. Dogecoin is expected to retest the $0.17 support level in the coming days, and there may be further declines. Buying on dips can be considered, and dollar-cost averaging can be used to spread risk. Although on-chain indicators are signaling positively, market volatility is high, so adequate preparation is necessary.

