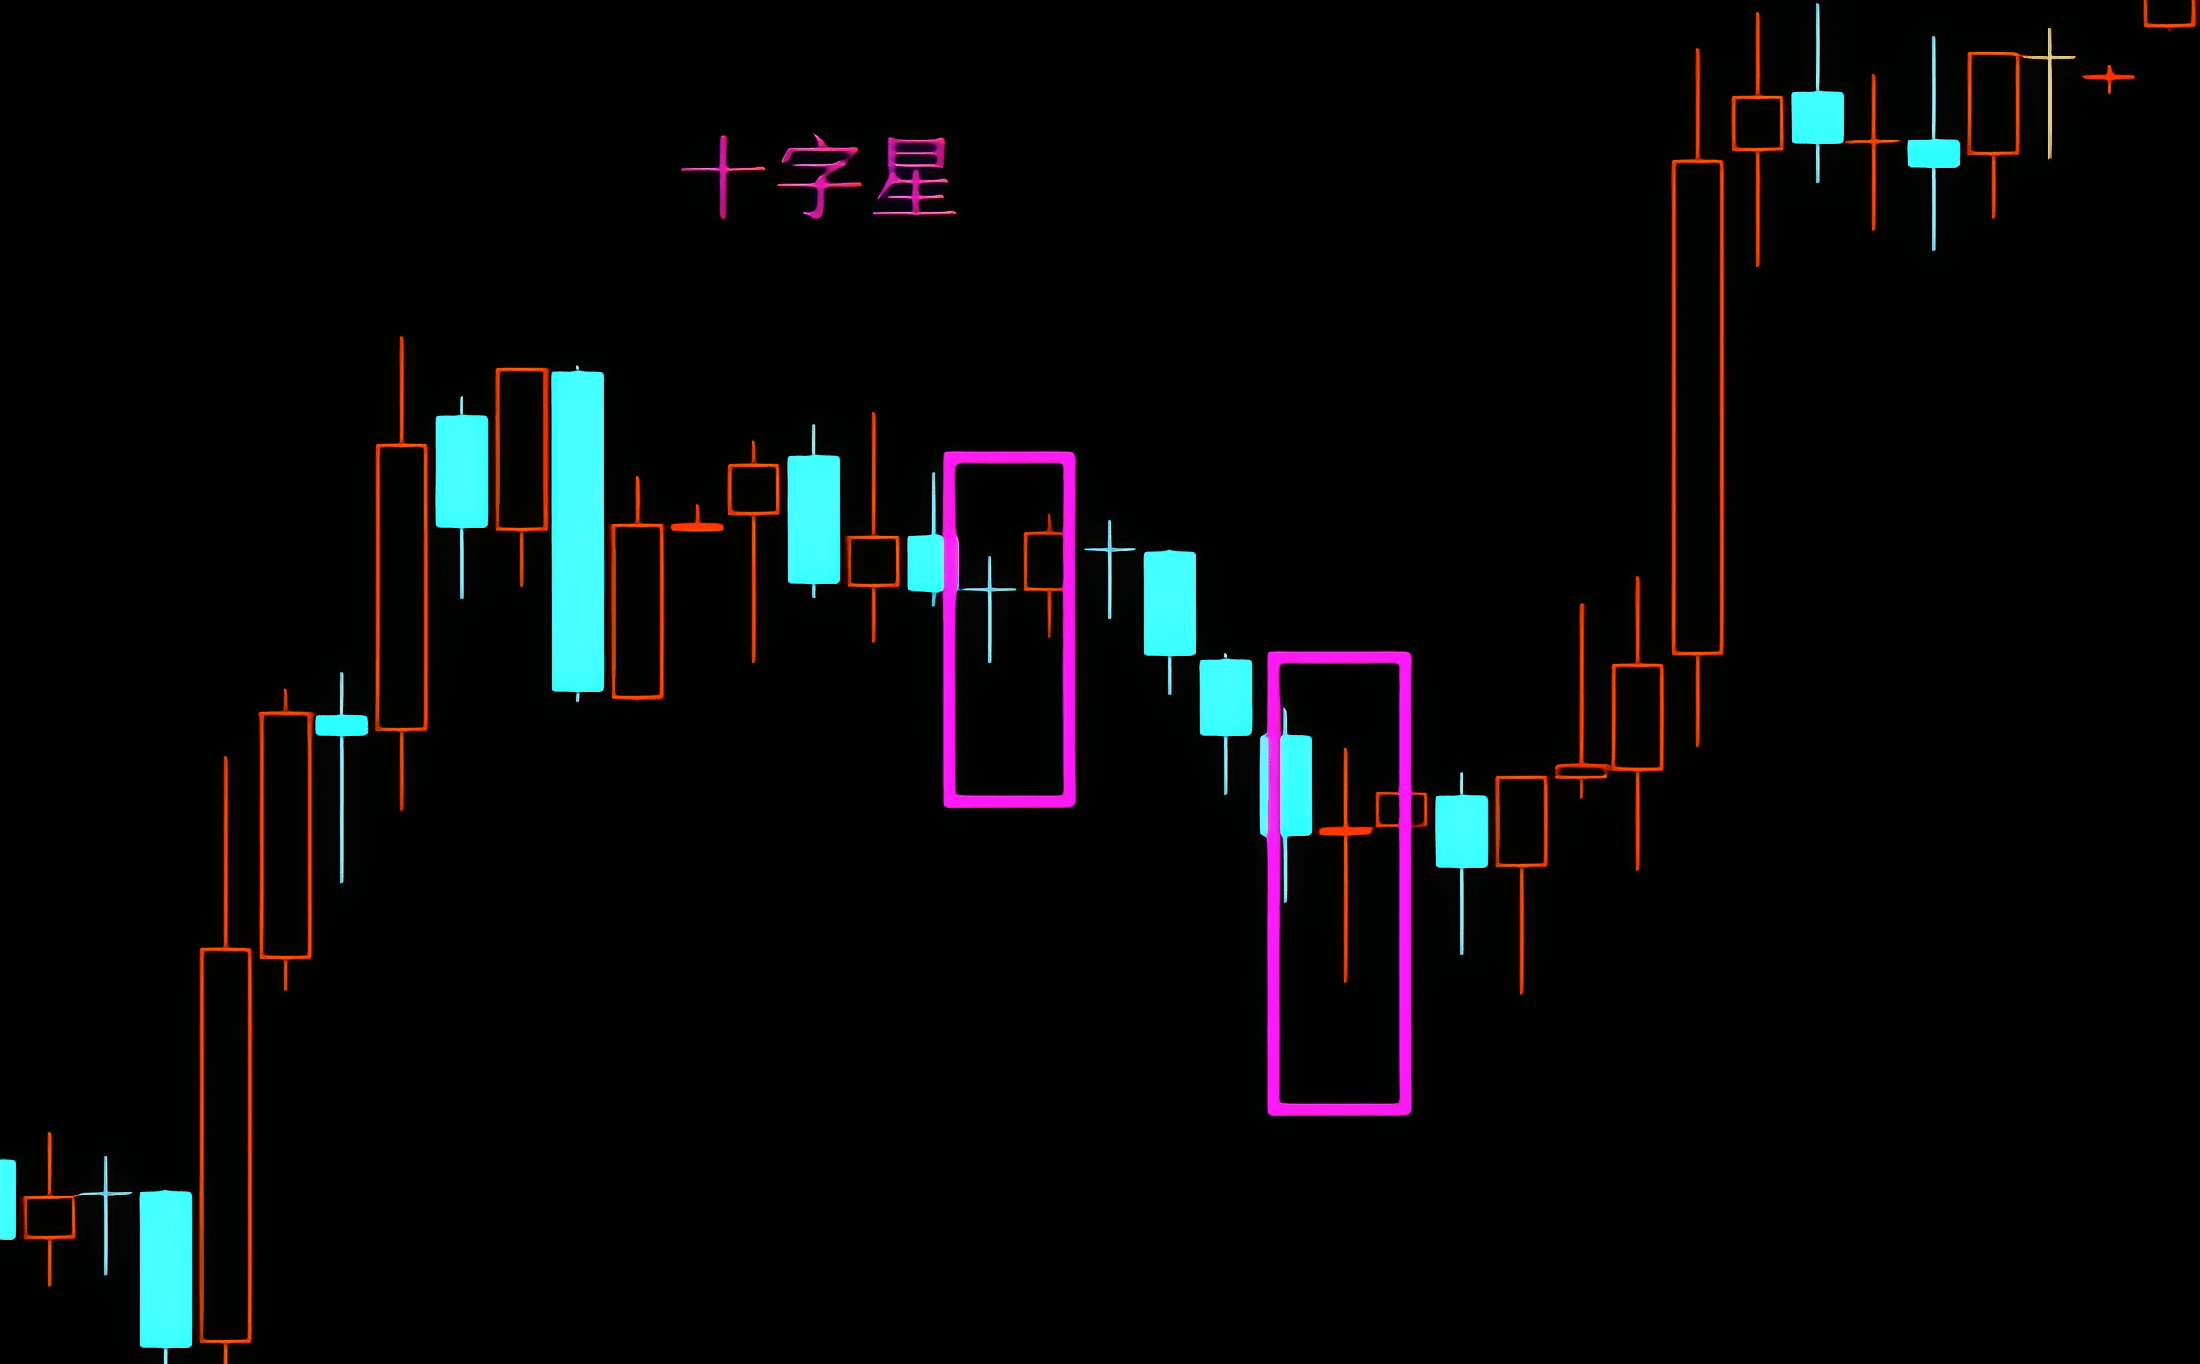
- Doji: The opening price and closing price are the same or very close, indicating market hesitation, which may suggest a trend reversal.
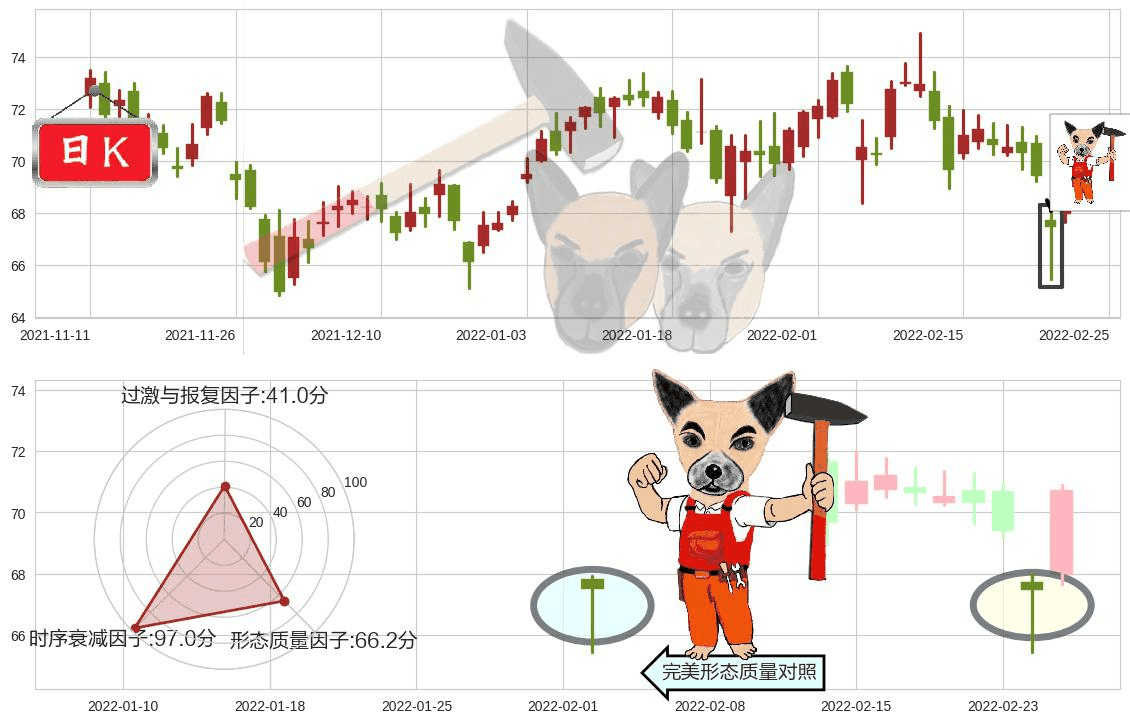
- Hammer: Has a long lower shadow with a small body located above the candle, generally appears in a downtrend, is a potential bullish signal.
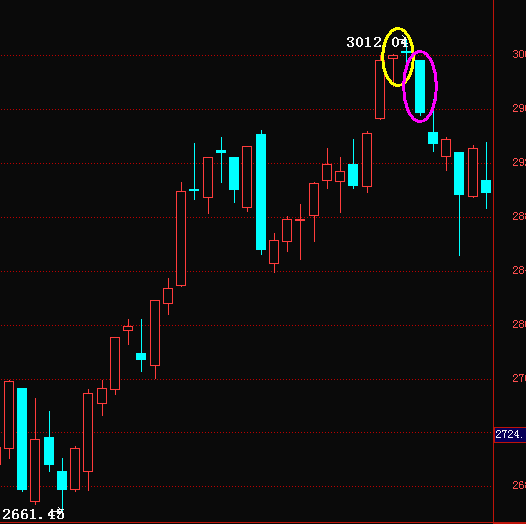
- Hanging Man: Similar to the Hammer pattern, but appears in an uptrend, is a potential bearish signal.
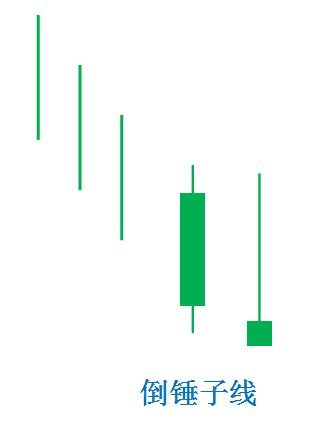
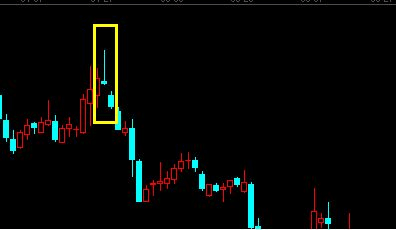
- Inverted Hammer: A long upper shadow with a small body located below the candle, usually appears after a downtrend, possibly indicating a bullish signal.
- Gravestone Doji: Has a long upper shadow and no lower shadow, prices open and close at the same level, appears after an uptrend, possibly indicating a trend reversal to bearish.
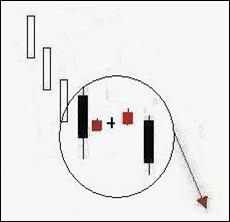
Double Candle Patterns
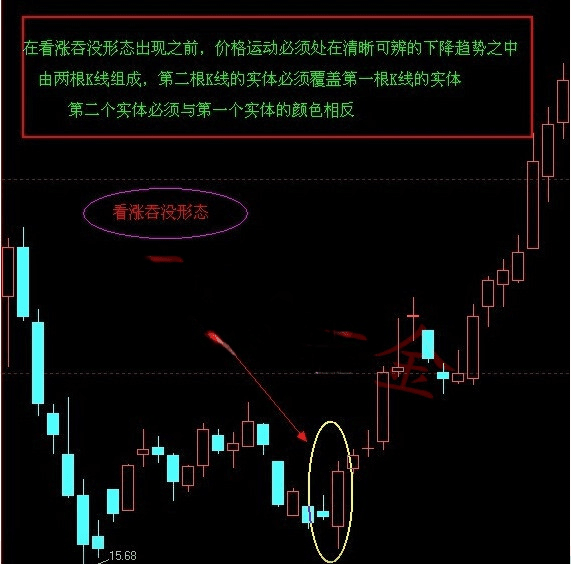
- Bullish Engulfing: A small bearish candle is followed by a larger bullish candle, which completely engulfs the former, indicating that buyers are in control and the trend may reverse to bullish.
- Bearish Engulfing: A small bullish candle is followed by a larger bearish candle, which completely engulfs the former, indicating that sellers are in control and the trend may reverse to bearish.
- Piercing Line: A bearish candle is followed by a bullish candle, with the opening price lower than the previous day's low, but the closing price higher than the previous day's midpoint, possibly indicating the start of an uptrend.
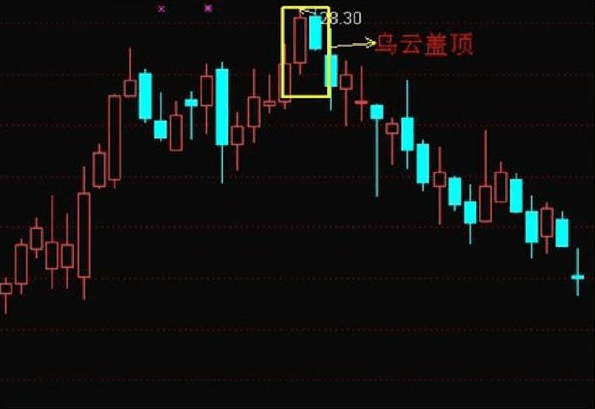
- Dark Cloud Cover: A bullish candle is immediately followed by a bearish candle, with the bearish candle's opening price higher than the previous day's high but the closing price lower than the previous day's midpoint, possibly indicating a trend reversal to bearish.
Three Candle Patterns
- Morning Star: Also known as the Morning Star, consists of three candles, the first day is a long bearish candle, the second day is a doji or small candle, and the third day is a long bullish candle, appears in a downtrend, and is a relatively reliable bullish reversal signal.
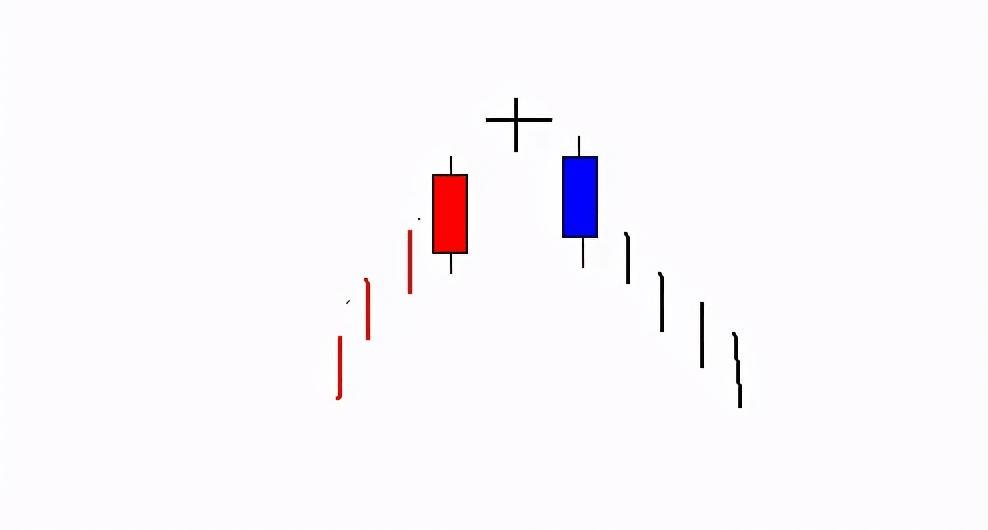
- Evening Star: Opposite to the Morning Star, appears in an uptrend, the first day is a long bullish candle, the second day is a doji or small candle, and the third day is a long bearish candle, signaling a bearish reversal.
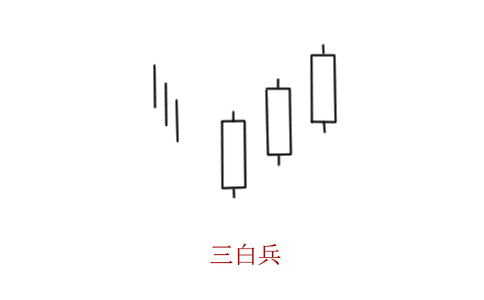
- Three White Soldiers: After a downtrend, three consecutive small bullish candles appear, indicating a high possibility of a significant upward movement.
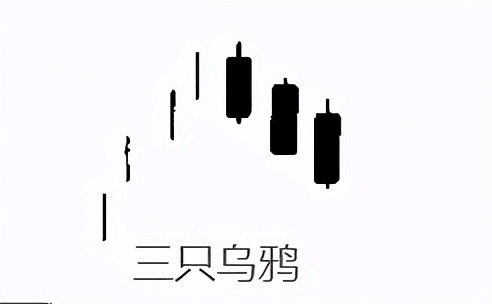
- Three Black Crows: Appears in an uptrend, consisting of three consecutive long bearish candles, indicating heavy selling pressure, and a bearish outlook for the future.
- Rising Three Methods: In an uptrend, a long bullish candle is followed by three small bearish candles, which do not break the opening price of the long bullish candle, and then another long bullish candle appears, continuing the uptrend.
- Falling Three Methods: Opposite of Rising Three Methods, in a downtrend, a long bearish candle is followed by three small bullish candles, which do not break the opening price of the long bearish candle, and then another long bearish candle appears, continuing the downtrend.
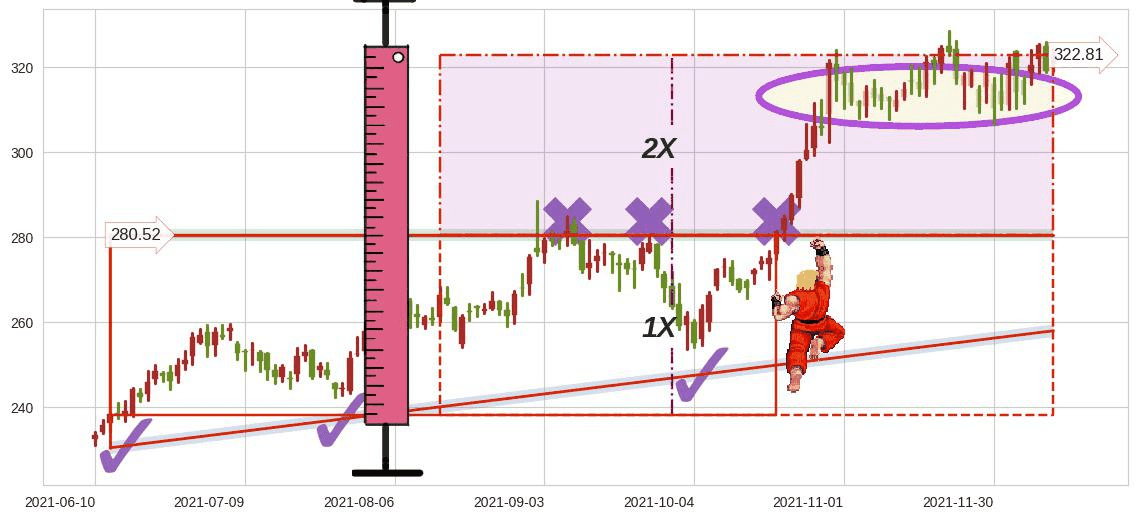
- Bullish Flag: In an uptrend, after a rapid price increase, the price enters a consolidation period, forming a downward-sloping parallelogram, and after the consolidation, the price continues to break upward, extending the uptrend.
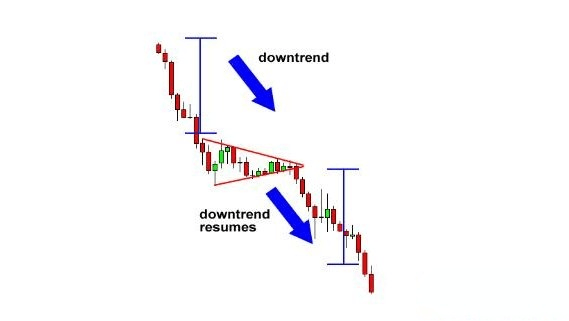
- Bearish Flag: In a downtrend, the price drops rapidly, followed by consolidation, forming an upward-sloping parallelogram, and after the consolidation, the price continues to break downward, extending the downtrend.