
Table of Contents
TRON’s Price-to-Revenue Ratio Signals Deep Undervaluation
Staking Metrics Further Cement TRON’s Financial Leadership
TRON’s Profitability Flips the Narrative in Layer-1 Ecosystems
Valuation Gap Highlights Strategic Entry Potential for TRON
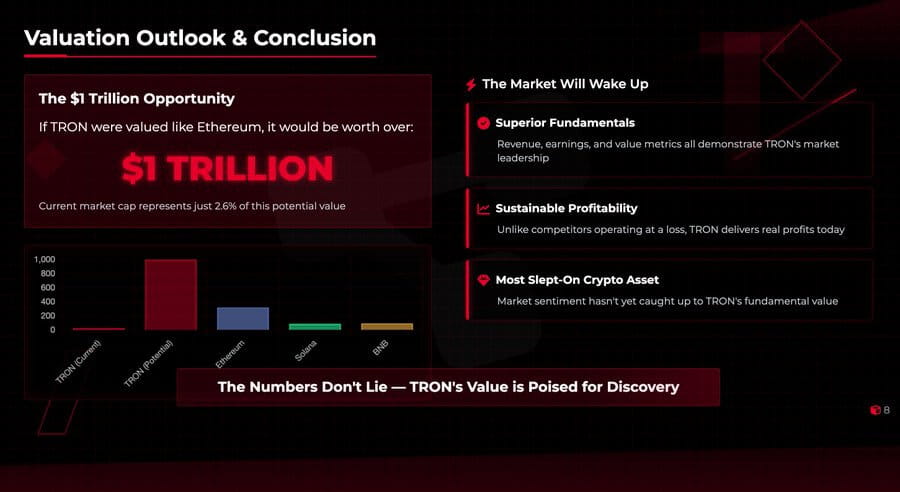
TRON leads Layer-1s in profits with $268M net income, far outpacing Ethereum, Solana, and BNB despite a much lower valuation.
With a 9% staking APY and the lowest P/E and P/R ratios, TRON offers unmatched yield-to-value alignment for long-term investors.
TRON generates 4x more revenue than Ethereum yet trades at just 8% of ETH’s market cap, highlighting massive undervaluation.
TRON (TRX) has emerged as the most undervalued Layer-1 blockchain, supported by measurable financial data, including a 96 Price-to-Earnings (P/E) ratio and $3 billion in annual revenue. These numbers surpass Ethereum, Solana, and Binance Coin across nearly every metric of profitability, efficiency, and yield. The data points reveal a sharp mismatch between TRON’s core earnings and its current market valuation.
https://twitter.com/dylN0chill/status/1933894219535376548
Ethereum’s reported revenue of $825 million and net loss of $1.8 billion stand in contrast to TRON’s $268 million in net profits. Solana, while often cited for technical innovation, trails far behind in financial performance with $432 million in revenue and a staggering $4.1 billion in losses. In comparison, Binance Coin (BNB) recorded just $20 million in revenue with an inflated P/E of 4,888, positioning TRON as a dominant asset on a valuation-per-output basis.
TRON’s Price-to-Revenue Ratio Signals Deep Undervaluation
Recent movements in the crypto valuation landscape have reshaped investor perception, drawing attention to networks with strong earnings-to-price balance. TRON’s Price-to-Revenue (P/R) ratio stands at just 8.6x, while Ethereum’s equivalent is 388x, Solana’s 213x, and BNB’s an outsized 4,863x. According to a report by Φ Intuit_Trading, this positions TRON as the most efficiently priced Layer-1 chain when adjusted for real revenue.

Source: Φ Intuit_Trading on (X)
The stark imbalance between market capitalization and revenue generation underscores this inefficiency. Despite producing 4x more revenue than Ethereum, TRON’s market cap is only $26 billion, a mere 8% of Ethereum’s $320 billion. Solana and BNB are also overvalued relative to output, with market caps of $92 billion and $96 billion, respectively, but significantly lower net income than TRON.
Staking Metrics Further Cement TRON’s Financial Leadership
Simultaneously, other market indicators suggest a different trend—one in which TRON offers the best passive income opportunity among top-tier crypto assets. With a 9% staking APY, TRON outpaces Solana (7%), Ethereum (3.5%), and BNB (1.5%) by wide margins. The high-staking yield points to strong network engagement, reinforcing the value proposition for long-term holders.

Source: (X)
TRON’s staking strength becomes more compelling when paired with its low P/E and P/R ratios. Investors are earning higher yields while buying into a fundamentally profitable chain. This yield-to-valuation alignment makes TRON attractive not only for staking rewards but also for strategic capital deployment.
TRON’s Profitability Flips the Narrative in Layer-1 Ecosystems
While many blockchain protocols operate at massive losses to gain market share, TRON is redefining sustainable growth. It stands alone with consistent net earnings, contrasting sharply with the negative profitability of Ethereum and Solana. This positive earnings model bolsters TRON’s case as a value-centric alternative in a field crowded by hype-driven tokens.

Source: (X)
Binance Coin, although marginally profitable, remains dwarfed by TRON’s scale. It's $20 million in net earnings pales next to TRON’s $268 million, further emphasizing the operational superiority of the TRON ecosystem. These metrics continue to reinforce why investors and analysts now refer to TRON as “the most slept-on crypto asset.”
Valuation Gap Highlights Strategic Entry Potential for TRON
TRON’s fundamental dominance highlights a bullish long-term trajectory, especially if repriced to reflect metrics comparable to Ethereum. If valued similarly, TRON’s market cap could surpass $1 trillion—nearly 40x its current size. That forecast, while aggressive, is grounded in comparative data, not speculation.
Source: (X)
Moreover, the blockchain’s ability to generate consistent fee income and reward stakeholders robustly makes it structurally superior in revenue distribution and tokenomics. As the broader crypto market slowly rotates toward fundamentals, TRON’s unmatched metrics are expected to draw institutional and retail inflows aiming for value and yield.


