 There are many theories of technical analysis, but Dow Theory is an indispensable one.
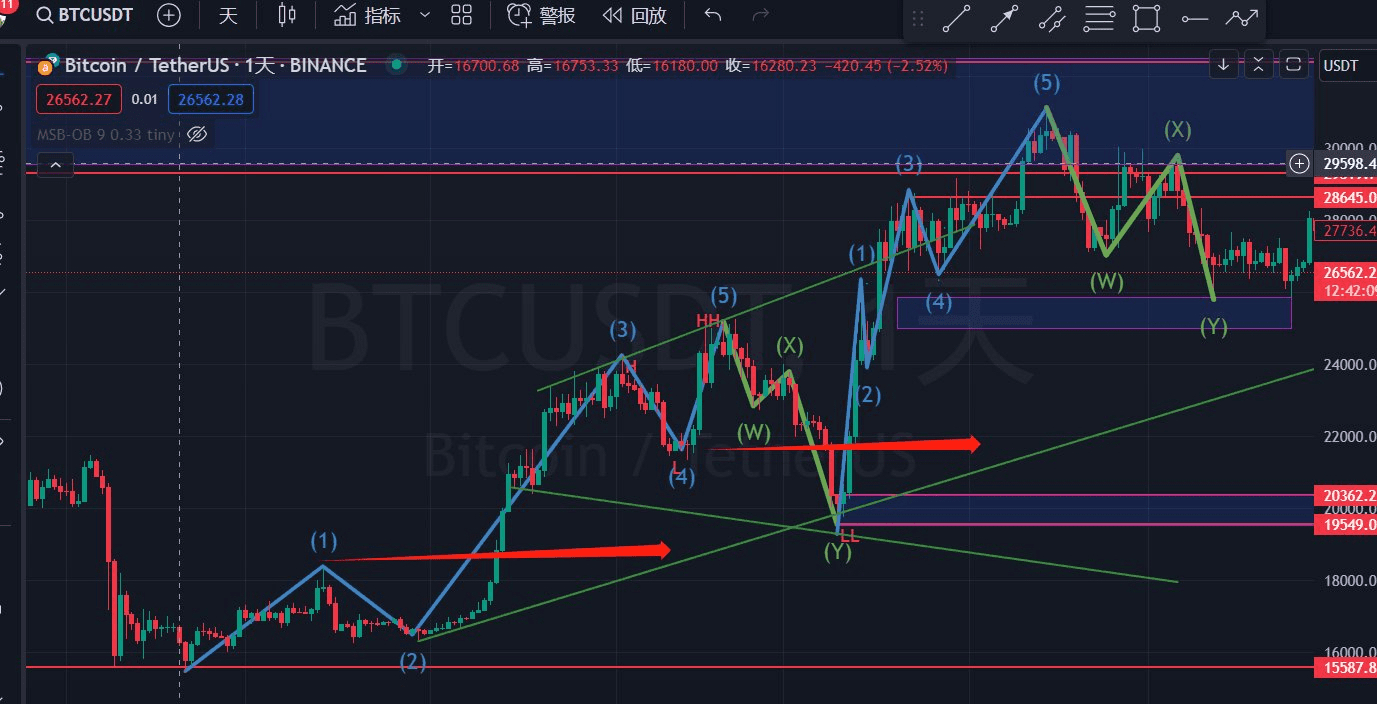
1. Trend Line Analysis: Dow Theory emphasizes the importance of trends, and trend line analysis is a core component. By drawing trend lines, one can identify the major trends, minor trends, and temporary trends in the market, as well as determine support and resistance levels.
2. Chart Pattern Analysis: In Dow Theory, specific patterns in price charts can provide predictions of price movements. Common chart patterns include head and shoulders, double tops, double bottoms, triangles, etc. By observing the emergence and evolution of these patterns, future price trends can be predicted.
3. Volume Analysis: Dow Theory holds that trading volume is one of the important indicators of price movements. By observing changes in volume, one can confirm the continuation or reversal of trends and assess the emotions and strength of market participants.
4. Confirmation and Cross-Validation: Dow Theory emphasizes the confirmation and cross-validation of trends. When the market reaches new highs or lows, and trading volume also increases accordingly, the continuation of the trend can be confirmed.
5. Using Indicators: Although Dow Theory is primarily based on price and volume data, it can also be combined with some technical indicators for analysis. For example, moving averages can be used to smooth price data and identify changes in trends, while the Relative Strength Index can be used to assess market overbought and oversold conditions.
Basic Principles
1. Average Price Encompasses All Factors.
2. The market has three types of trends.
3. Major trends are divided into three phases: Accumulation, Warming, Distribution.
4. Multi-Indicator Resonance
5. Volume and Price Together: Trading volume validates trends.
6. Reversal Signals
The technical analysis methods based on Dow Theory primarily include:
1. Trend Line Analysis: Trend line analysis is used to identify support and resistance levels for major and intermediate trends.
2. Chart Pattern Analysis: Chart pattern analysis is used to identify specific patterns in price charts, such as head and shoulders and double bottoms, to predict future price trends.
3. Volume Analysis: Volume analysis is used to observe changes in trading volume to confirm trends and assess the emotions of market participants.
It is important to note that Dow Theory is a subjective analysis method that relies on the interpretation of price charts and trading data by technical analysts. In practical application, it can be combined with other technical indicators and quantitative models for comprehensive analysis to increase accuracy and reliability.
At the same time, changes in market behavior and environment may affect the effectiveness of Dow Theory, so investors should treat it with caution and make decisions in conjunction with other analytical tools and risk management strategies. #DowTheory #加密市场回调