Ethereum ($ETH ) recently touched a resistance zone near $2,879 before pulling back to around $2,760, marking a 1.8% decline over the last 24 hours. One notable signal is the 15 minute RSI, which has dropped sharply to 17, a level indicating extremely oversold conditions. On the 1-hour chart, the MACD has flipped bearish, reflecting short-term selling pressure. However, the spike in trading volume during the dip suggests that institutional or "smart money" investors may be accumulating, a potential early signal of a rebound.
Despite the pullback, Ethereum’s broader 4 hour trend remains technically intact, though momentum is fading and bullish conviction appears weak. The immediate support level to watch is $2,754. If this level holds, there’s a strong possibility ETH could retest the $2,800–$2,820 zone. However, a breakdown below $2,754 could open the door for further losses, potentially bringing ETH down to the $2,670 area. For a meaningful recovery, the RSI must reclaim the 30 mark, and traders should monitor for a bullish MACD crossover on shorter timeframes.
Globally, recent analyses by reputable outlets such as CoinDesk and Forbes maintain a cautiously optimistic outlook on $ETH . CoinDesk notes that Ethereum is finding strong support between $2,620 and $2,700, citing healthy volume recoveries and V-shaped bounces. Forbes and other technical analysts predict a medium-term price target between $3,000 and $3,200, assuming current support zones hold.
In summary, Ethereum $ETH appears to be undergoing a short-term correction within a larger bullish context. While indicators suggest oversold conditions and a potential bounce, price action around the $2,754 support level will be critical. If this zone is defended successfully, the current dip may represent a buying opportunity rather than the beginning of a deeper downtrend. Investors should remain cautious, avoid chasing volatile moves, and wait for confirmation from key technical signals before taking positions.
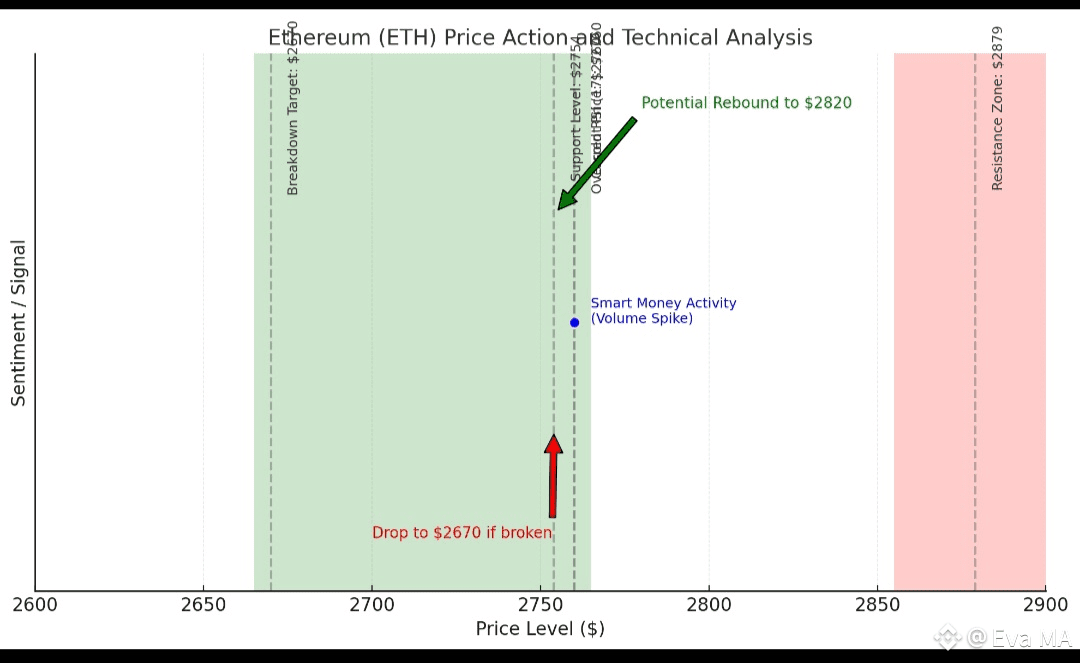
Here's a visual analysis chart of Ethereum's recent price action. It highlights key resistance and support zones, the oversold RSI condition, and potential price directions. This snapshot provides a strategic view of current market signals, helping traders plan their next moves based on technical levels and volume-based signals.

