I have been in the cryptocurrency circle for ten years, and have been a professional cryptocurrency trader for six years, more than 3,100 days. I have tried long-term, short-term, ultra-short, and swing trading, basically all types of methods. I have a say in this issue.
I have always said that mastering a skill requires the 10,000-hour rule. 8 hours a day, more than 200 days a year, almost 5 years, and this is just the beginning.
The foundation for stable profit. There will be big pitfalls within 10 years, so for the sake of safety, do not put the principal beyond your ability within 10 years.
Many experts who have made tens of thousands to tens of millions or even hundreds of millions of dollars just use contracts with large multiples, and many of them have died in a bear market, but you just don’t know it. Human nature often makes people lose the ability to make correct judgments in the face of big trends.
Back to the topic, let me share with you here:
When trading in the cryptocurrency world, it is difficult to change others, and it is also difficult to change yourself; but only by changing yourself will there be hope!
It is difficult to change others, and it is also difficult to change yourself;
But there is hope only if you change yourself
There are no ifs in the financial market, only results!
We can’t get results from trading in the cryptocurrency circle, so we must have done something wrong;
To be able to get results consistently, you must be doing something right, that’s all.
The way we think affects our daily behavior, and our daily behavior leads to the ultimate results.
Losing money is not scary. If you lose money, we must find out the real reason for the loss and make up our minds to change it immediately, which can help us turn losses into profits.
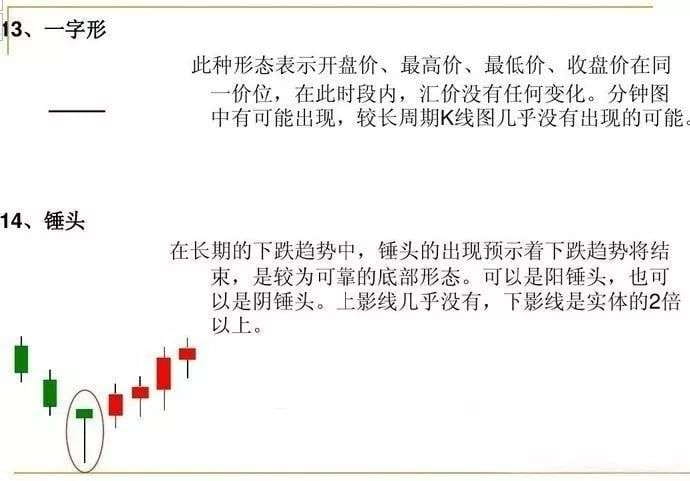
The most terrifying thing is not to ignore problems, avoid them, or fail to solve them head on.
Everything has cause and effect. If you sow good seeds, you will reap good results. If you sow bad seeds, you will reap bad results.
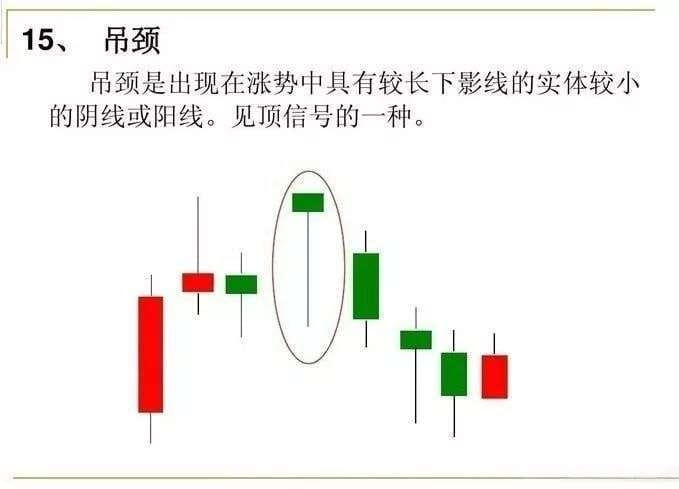
Where we are today is a result of every decision we have made before.
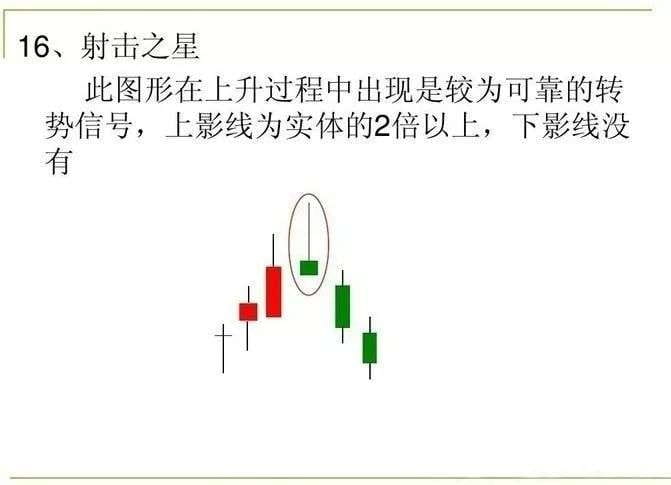
No matter the result is good or bad, we have to bear it. In the adult world, once we make a choice, even if it is wrong, we have to go through it on our knees.
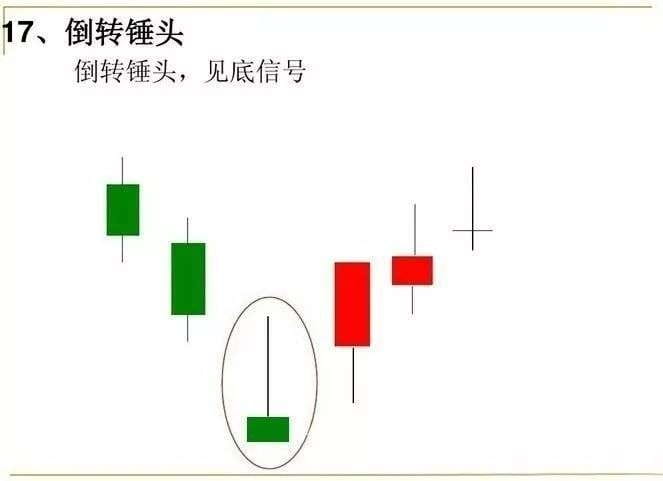
It depends on whether we can accept and face the final result calmly when it happens to each of us.
In the adult world, we should never pretend to be working hard, because the final result will not play along with us.
We must learn to reflect and summarize more in our daily lives, continue to improve on the good things, and change the bad things immediately. In time, we will all get better.
The same is true for trading in the cryptocurrency circle. You must abandon the mentality of relying on luck, the desire to get rich quickly or speculation, and every transaction that is beyond your ability and cognition.
Before every transaction, ask yourself whether you understand it, whether you have a solid basis for your trading decision, whether you have a good strategy and risk control system, whether you can accept failure, etc.!
Having a clear understanding of our own abilities is an essential element for us to be qualified investors.
As long as you want to change, any time is just right!
Qingtian teaches you how to read naked K-line in 5 minutes and accurately judge the buying and selling points!
K-line chart is also called candle chart, Japanese line, Yin-Yang line, bar line, etc. The common term is "K-line", which originated from the rice market transaction in the Tokugawa Shogunate era (1603-1867) in Japan in the 18th century. It is used to calculate the daily rise and fall of rice prices. Because of its unique marking method, people introduced it into the analysis of price trends. After more than 300 years of development, it has been widely used in TD, futures, foreign exchange, options and other securities, virtual currency markets.
The K-line chart contains rich Eastern philosophical thoughts, and shows the mutual conversion of the "momentum" of the long and short sides through the changes of yin and yang.
K-line chart: A K-line records the price changes of the currency market in one day. Arranging the K-lines of each day in chronological order forms the historical price changes, which is called a K-line chart.
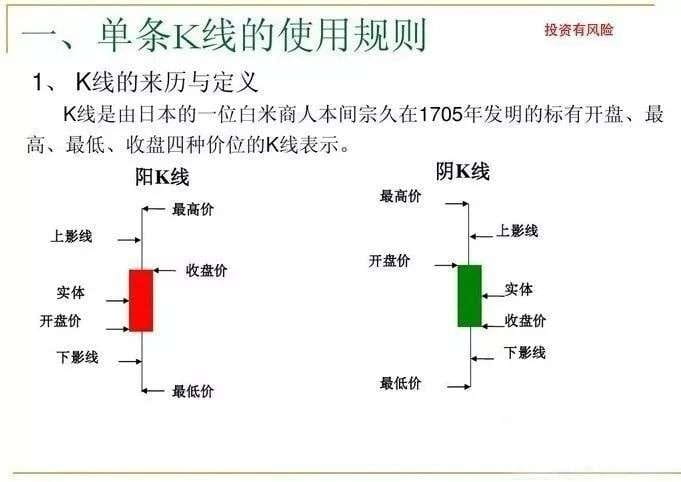
Composition price: K-line is composed of four price levels: opening price, closing price, highest price and lowest price. The opening price lower than the closing price is called Yang line, and vice versa. The rectangle in the middle is called the body, the thin line above the body is called the upper shadow line, and the thin line below the body is called the lower shadow line. K-line can be divided into daily K-line, weekly K-line and monthly K-line. Minute line and hour line are also commonly used in analysis software. K-line is a special market language, and different forms have different meanings.
How to draw a K-line chart: Use trading time as the horizontal axis and price as the vertical axis to continuously draw the daily K-line to form a K-line chart.
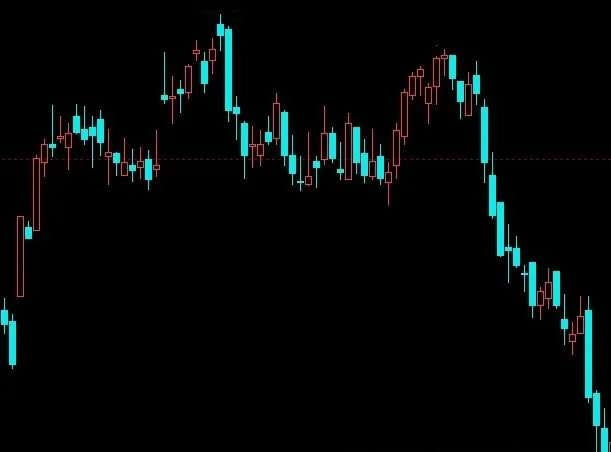
The candlesticks in the candlestick chart are divided into positive and negative lines. Generally, red candlesticks are used to represent positive lines, and green candlesticks are used to represent negative lines. If the closing price in the time period represented by the candlestick is higher than the opening price, that is, the price rises, the candlestick will be painted red, otherwise it will be painted black. If the opening price is exactly equal to the closing price, a cross line is formed.
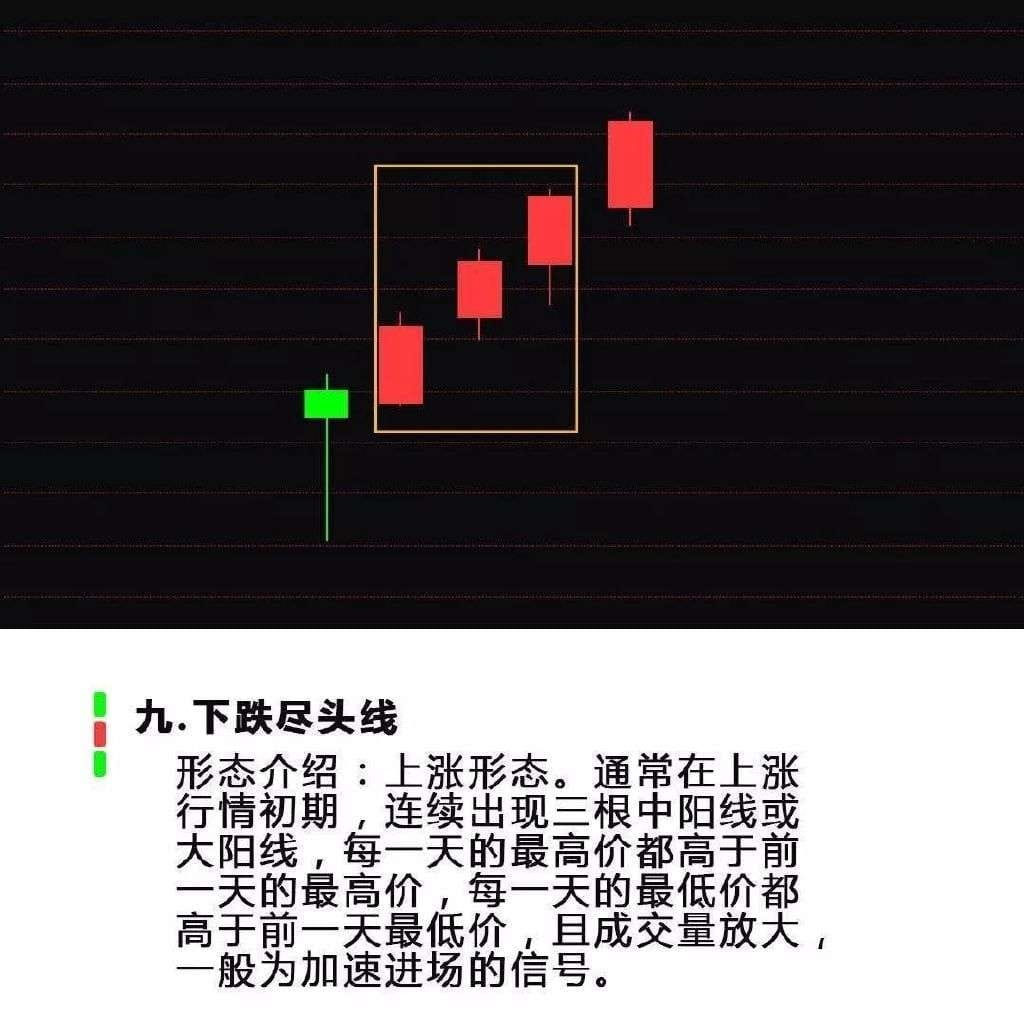
So what does a candlestick chart look like and how do you read it? Please look carefully at the following picture!
What to analyze in naked K trading?
There are four main modules of naked K analysis: trend, position, momentum, and signal.
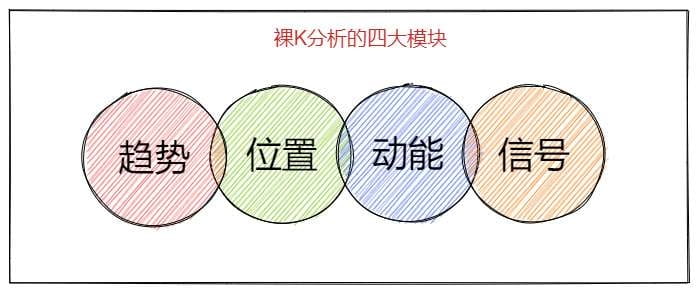
These four major analysis modules do not exist independently; they are interdependent and complementary.
In the face of complex and ever-changing market trends, if we can analyze from these four major modules, our analysis can be relatively holistic and comprehensive, so that we will not blindly open a position when we see a trading signal. This is a common bad trading habit among many beginners.
How to judge the trend?
When talking about trends, remember a few key words: structure, direction, and level.
The judgment of naked K trend is mainly based on the definition of trend in theory.
Structurally, the gradual rise of significant highs and lows is considered an upward trend, while the gradual decrease of significant highs and lows is considered a downward trend. The trend between highs and lows is called a volatile trend.
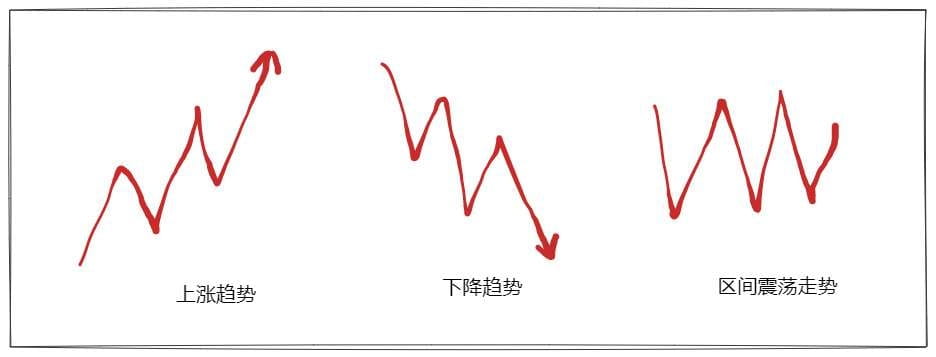
Figure (2)
The biggest difficulty in trend judgment is the division of levels and the conversion of trends.
The division of trends at different levels involves the issue of primary and secondary rhythms. Beginners are easily affected by small-level trends and often ignore the main trend, resulting in confusion in trading direction. Is the change of trend a trend correction or a trend reversal? It is not easy for us to judge because there is no absolutely quantifiable standard.
To solve the problem of size levels and trend conversion, my approach is to define your main trends and critical points.
Because the starting point of the trend selection is different, the trend direction in your eyes and others' eyes may not be the same. So you need to define the trend you have divided, find out its main trend, and then find the critical points of each trend level. The critical points are generally horizontal lines and trend lines.
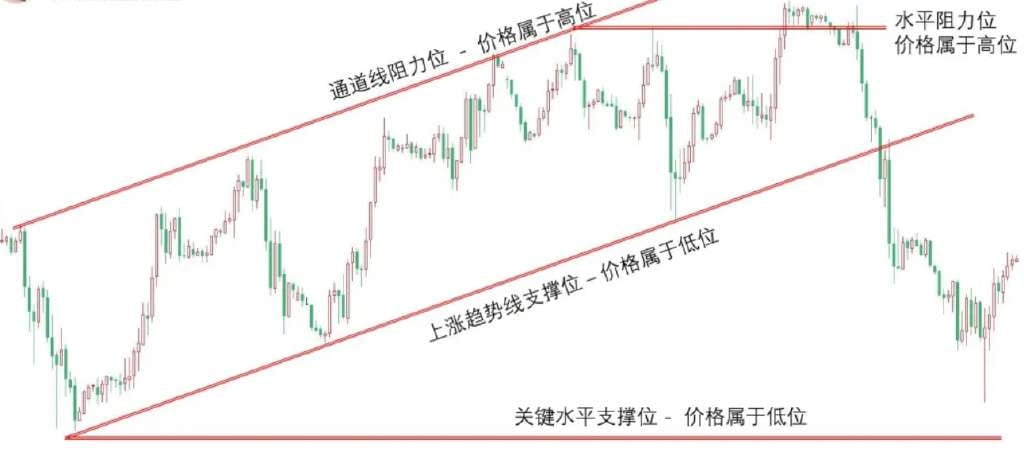
Is the price position high or low?
Keywords for position: support level, resistance level, profit and loss ratio
Why do you chase high prices? Why do you always make small profits and suffer big losses? This is related to the price position judgment.
If you always go long at resistance levels and short at support levels, not only will your failure rate be high, but your profit-loss ratio will also be low.
Location is also important. Is the price high or low? Here are my basic criteria:
Support level belongs to the low price
Resistance levels belong to price highs
Because the take profit setting is also set at the support and resistance levels, so:
Buy at support level and sell at resistance level, the profit and loss ratio of long position is the highest.
Buy at resistance level and sell at support level, short selling has the highest profit and loss ratio.
Unless you trade a breakthrough, all long positions at resistance levels are considered opening high positions, and all short positions at support levels are considered buying on the decline.
This is how you judge the price based on support and resistance levels. If you add the concept of trend, how would you judge the price?
How to judge the conversion of kinetic energy?
Keywords for momentum: trend, candlestick pattern, slope
Momentum can be said to be the cornerstone of trend movement. Without kinetic energy, there will be no trend, so momentum analysis is also a very important module.
What is strong kinetic energy and what is weak kinetic energy?
Strong kinetic energy: trend, consecutive positive and negative lines, large positive and negative lines, large slope
Weak kinetic energy: range trend, cross star, small positive and negative lines, small slope
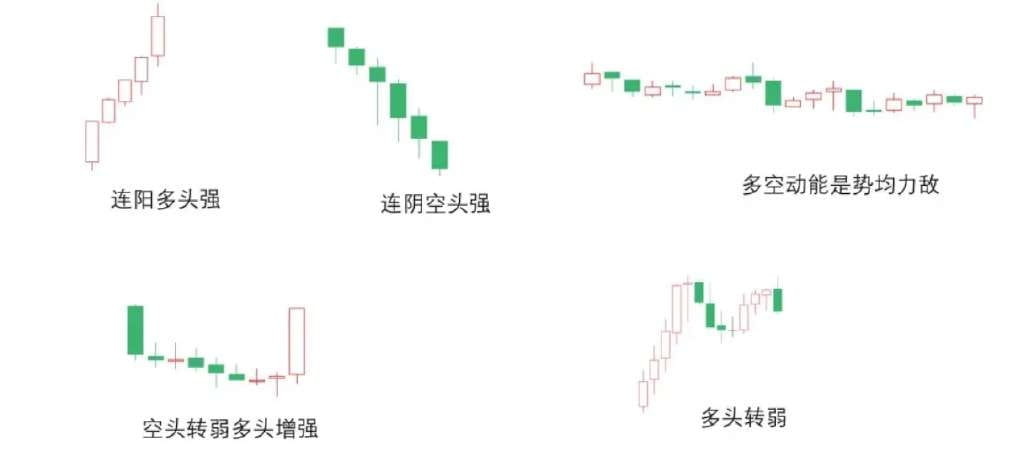
In an upward trend, the bullish momentum must be stronger than the bearish momentum.
In a downward trend, the short momentum must be stronger than the long momentum.
Range oscillation must be a state of equal strength between bears and bulls, among which narrow fluctuations are a trend of energy accumulation.
The change from trend trend to range trend is a trend in which the momentum changes from strong to weak.
The trend from a large positive line to a small positive line is a trend of weakening bullish momentum.
The slope changes from large to small, which means that the kinetic energy is weakening, and vice versa.
The above is to judge the changes in price momentum based on trends and price K-line patterns, and thus determine the direction of future price movements.
So, if we add position, what special changes will there be in the analysis of the strength of kinetic energy?
Is it reliable to enter the market based on signals alone?
Keywords: trend, position, momentum
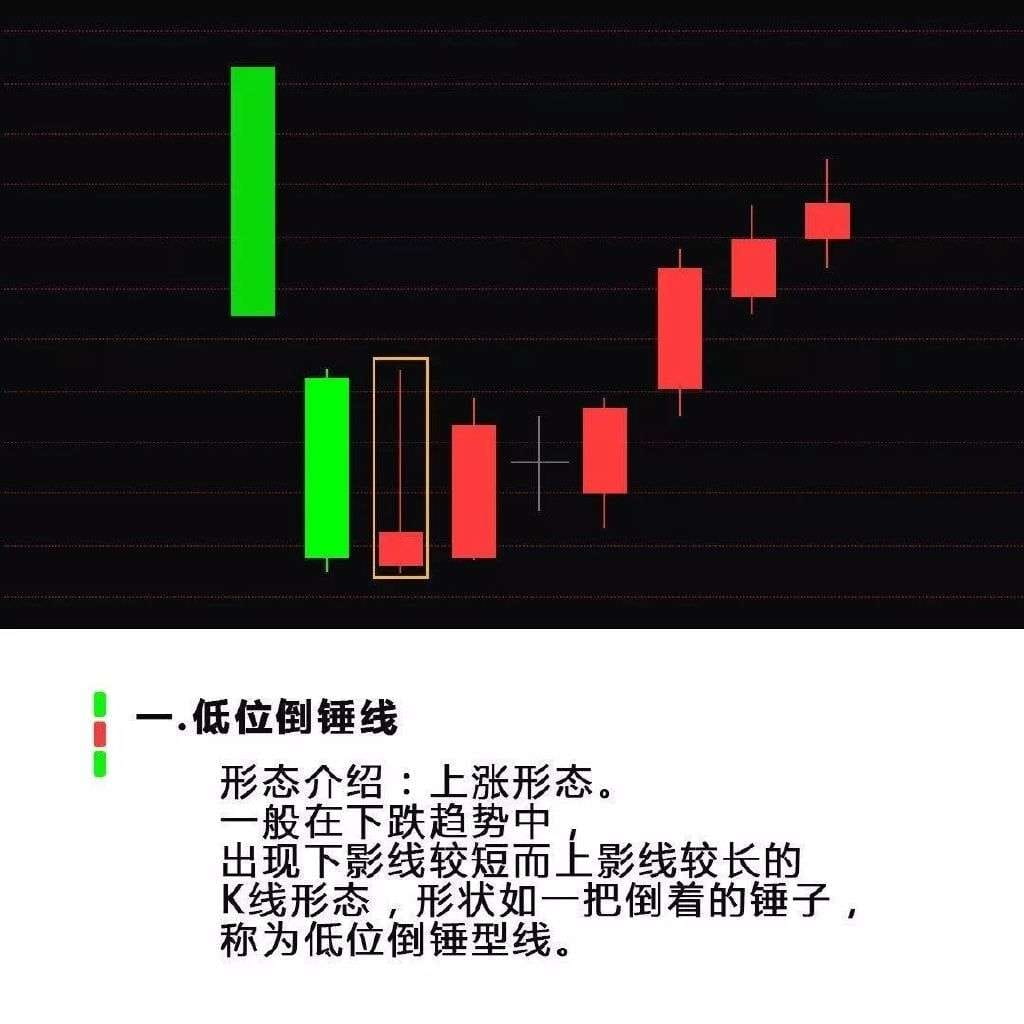
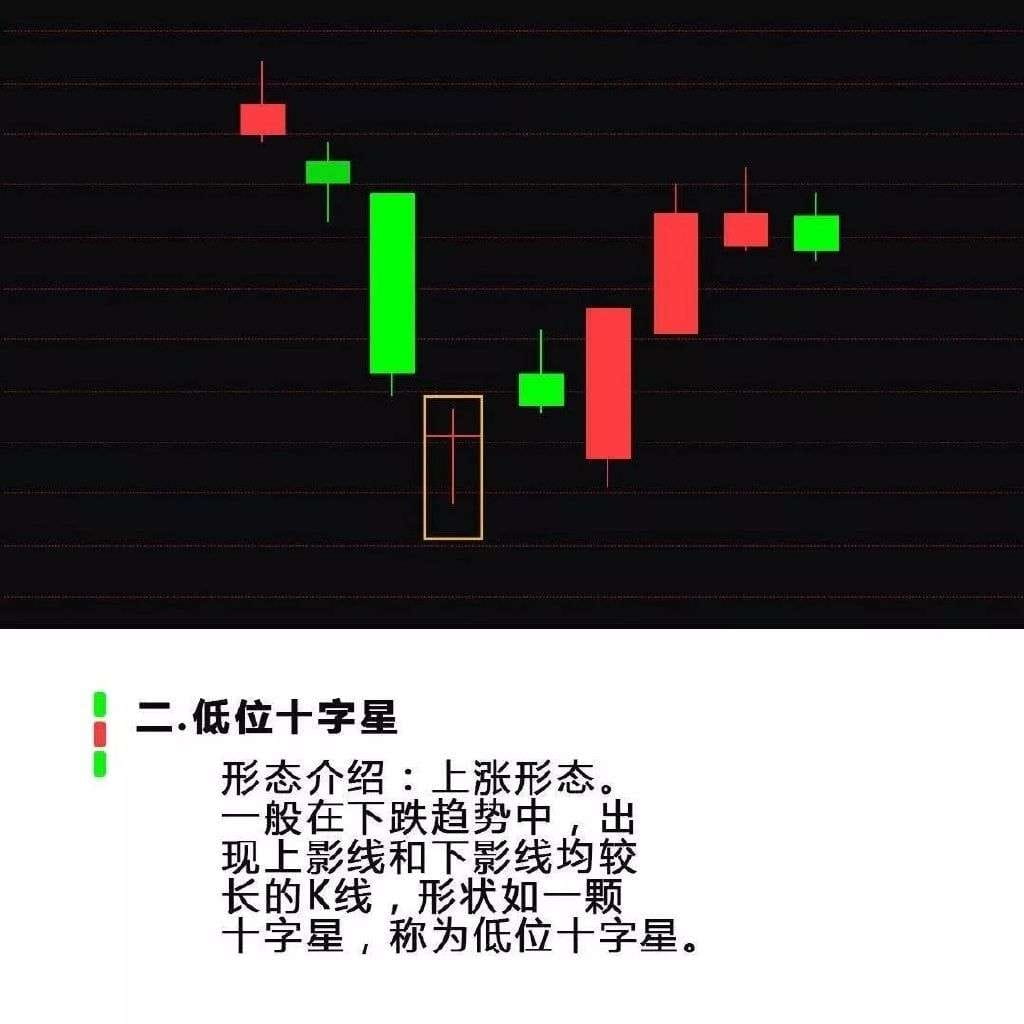
When it comes to signals, many of us only think of starting signals such as hammer lines, pregnancy lines, engulfing lines, etc.
When it comes to trading signals, they must be based on the three major modules of trend, position, and momentum. If you separate yourself from the analysis of the first three modules and directly look at the signals to enter the trade, you will find that the success rate is not high. This is why it is repeatedly emphasized that trading signals cannot be separated from market conditions.
Personally, sometimes I don’t always wait for a trading signal to appear before entering the market. That’s because I already have a good grasp of the price trend, position and momentum.
In conclusion, this article explains the four major analysis modules of naked K. Each module also covers many knowledge points, which requires you to have a more solid foundation. But in any case, the four major modules are a large framework for analysis. If we cannot find the direction in analysis and trading, we might as well sort out the market from these four modules.
Beyond this, there are several other key technical levels to watch:
1) Psychological support and resistance points – usually round exchange rates such as 1.00, 1.10, 1.20, etc. Many traders tend to set orders around these round numbers.
2) Fibonacci Retracement Levels – Used to find potential levels and trends for price retracements. When used on higher time frames, important Fibonacci levels such as the 61.8% retracement level can become key technical levels where there may be a large number of open orders.
3) Pivot Points - Pivot points are points where the market direction changes during a day. By simply calculating the high/low and closing price of the previous day, a series of points can be obtained, which may form key support and resistance lines. Range traders can use the pivot point system to confirm potential reversal points, while breakout traders can use the pivot point system to confirm key breakout positions of the trend.
4) Dynamic support and resistance points - key technical levels are not necessarily fixed and can be dynamic. Moving averages are often used to identify dynamic key technical levels that appear near the 50-day EMA, 100-day EMA, 200-day EMA, or Fibonacci EMA levels (such as the 144-day EMA).
5) Convergence Areas of Support/Resistance – These are areas where different important technical levels intersect. For example, an uptrend line may provide horizontal support for prices right at the level of horizontal support. This will form a converging support area where the uptrend line meets the horizontal support.
Finally, I will share 3 useful Price Action trading models (dry stuff)
Beginner traders believe that Price Action is limited to a few simple candlestick patterns, such as fakey bar, pinbar, outside bar, etc. This is a very one-sided and superficial understanding. This article shares several trading models used by professional traders. Only by associating with experts can you broaden your horizons.
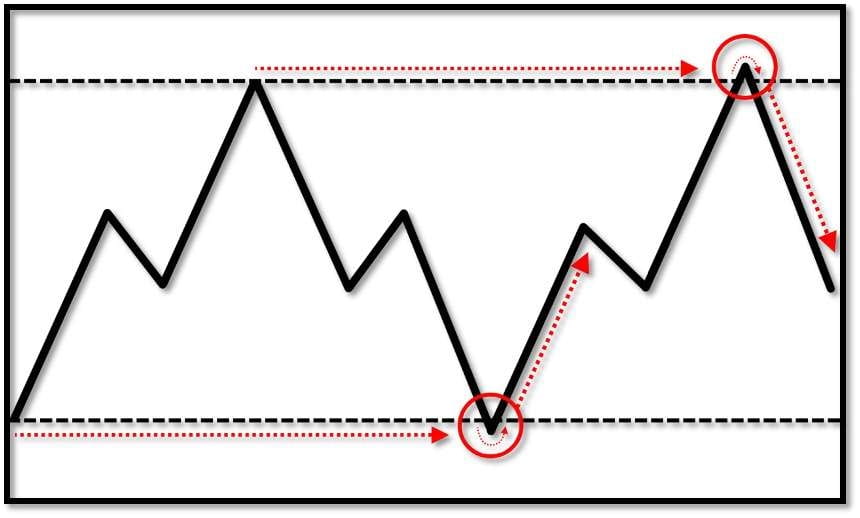
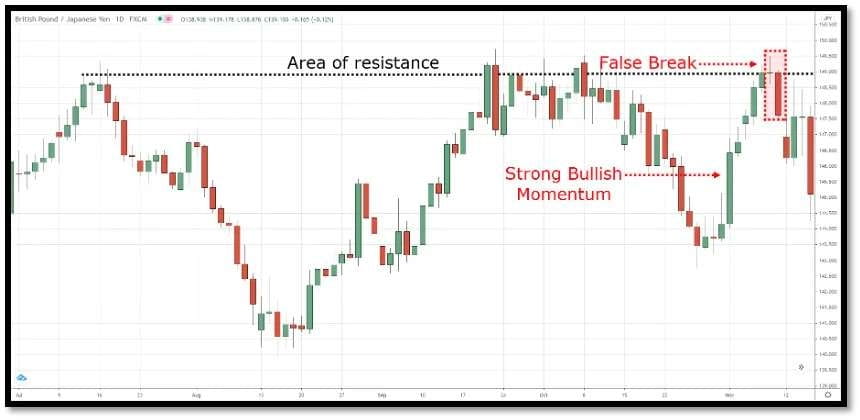
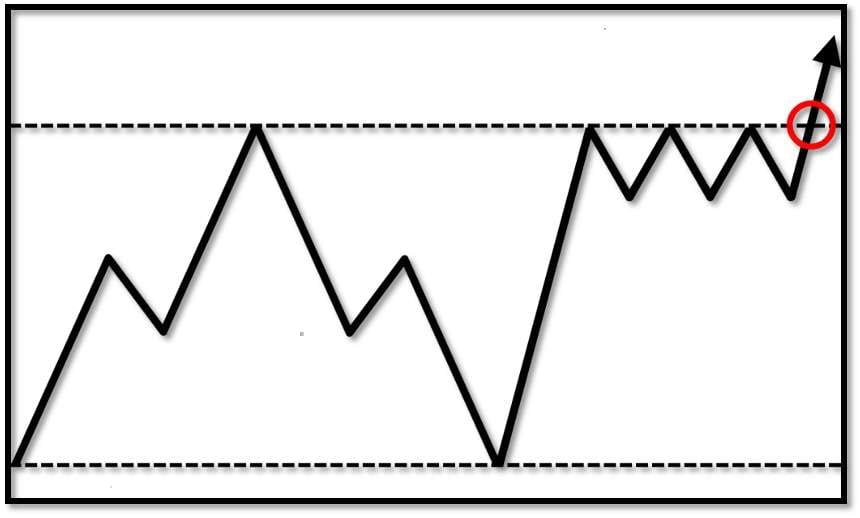
Model 1: False Breakout
False breakouts are often used in oscillating ranges. They are the best model for buying low and selling high, and are often used for range reversal trading. A strong reversal candle is formed at the low point of the band. After the price breaks through the support and resistance levels, a strong reversal candle is formed again. This model can be judged as a false breakout, and short selling is done after this candle closes.
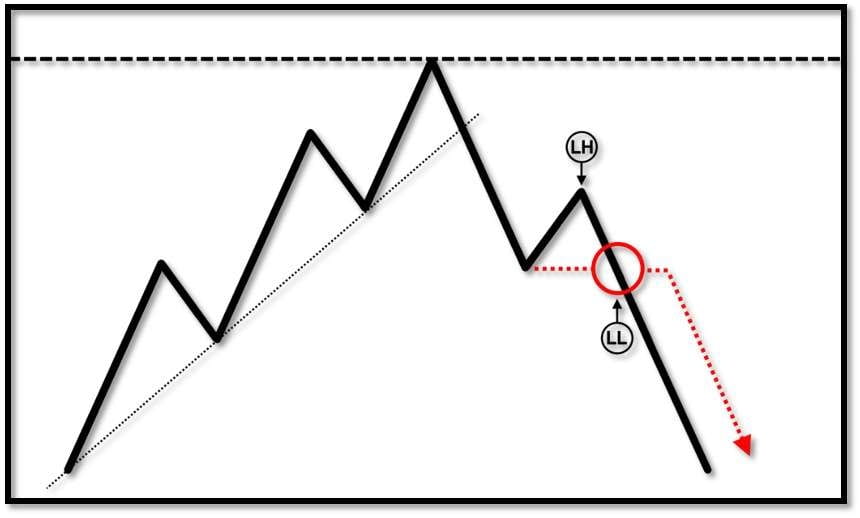
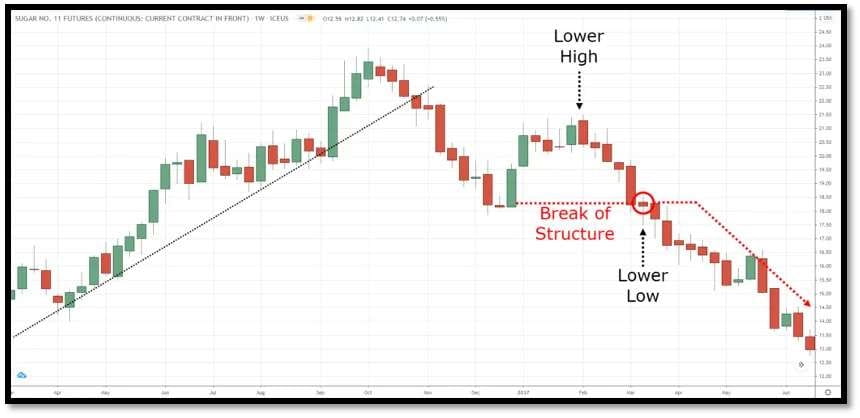
Model 2: Inversion Structure
When the price stops making new highs at the resistance level and forms lower highs and lower lows. Lower high, lower low. Enter the market and short after the price falls below the lower low. This is a standard reversal structure.
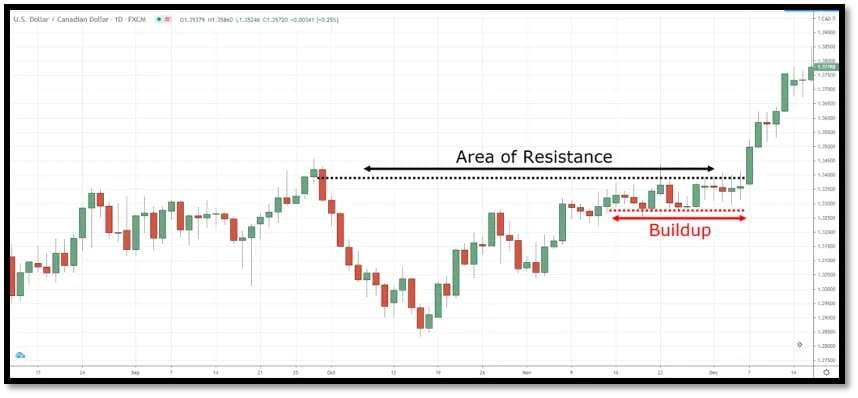
Model 3: Pre-breakthrough
The formation of a narrow range of fluctuations at the boundary of key support and resistance levels is a precursor to a price breakthrough. Pre-breakout models are favored by professional traders.
How to judge the trading momentum stage! (Dry stuff)
Methods for judging the accumulation stage of futures through technical analysis:
1. Observe the price pattern: the price rises and falls within a narrow range for many consecutive days, forming a picture similar to the foundation piles of a building, that is, a dense area. This may mean that the market is gathering momentum, and once it breaks upward or downward, it may trigger a larger market.
2. Analyze trend lines: Pay attention to the angle and stability of trend lines. Trend lines with a 45° angle may be more meaningful. Even if a steep trend line is broken, it does not necessarily mean a trend reversal, but may just be a normal adjustment; while a flat trend line indicates that the trend is weak.
3. Use of moving average: You can use simple moving averages, such as ma60, to determine the long and short directions. If the price is above the moving average, it may be in the accumulation stage of an upward trend; conversely, if it is below the moving average, it may be in the accumulation stage of a downward trend.
4. Trading volume and open interest: Trading volume represents the activeness of long and short positions in the market, while open interest reflects the view on the future market. In the accumulation phase, changes in trading volume and open interest can also provide some clues. When open interest gradually increases during the accumulation process, it may mean that market participants are gradually converging on the future direction.
5. Pay attention to technical indicators: such as MACD, KDJ, RSI and other indicators. Although these indicators have certain limitations, they can reflect the market's momentum, overbought and oversold conditions from different angles. However, the signal of a single indicator may not be accurate, and it is necessary to combine multiple indicators for comprehensive judgment.
6. Time factor: There is a saying that "time trades for space". After a long period of sideways consolidation or a breakthrough in a triangular consolidation, the market trend may be more fierce, and its amplitude and speed may be proportional to the length of time of consolidation.
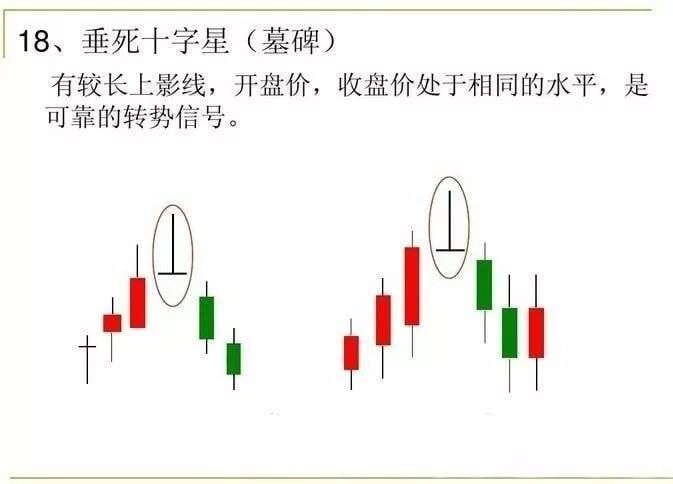
7. Signs of reversal pattern: Although a complete reversal pattern has not yet been formed, we should pay attention to some early signs. For example, in an upward trend, the length of the Yang line gradually shortens, or a Yin line with an upper shadow appears after opening high and closing low; in a downward trend, the Yin line gradually shortens, or opens low and closes high.
The most profitable trading model on a sunny day: [Secondary Blocking Pattern] Today I will share the key details!
With pictures and text, it is of great help to all novices and veterans!
1. There is a form that is "simple and easy to use" with a high success rate for bottom fishing and top fishing!
That is the [Secondary Sniper Form]!
Continue reading below⬇️
In the picture, the bulls made their first sniping attack, and the strength was average.
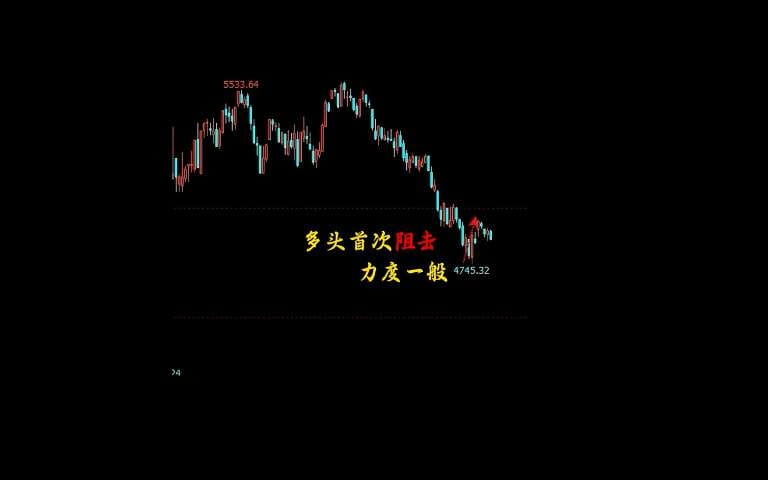
Pay attention to the picture below⬇️
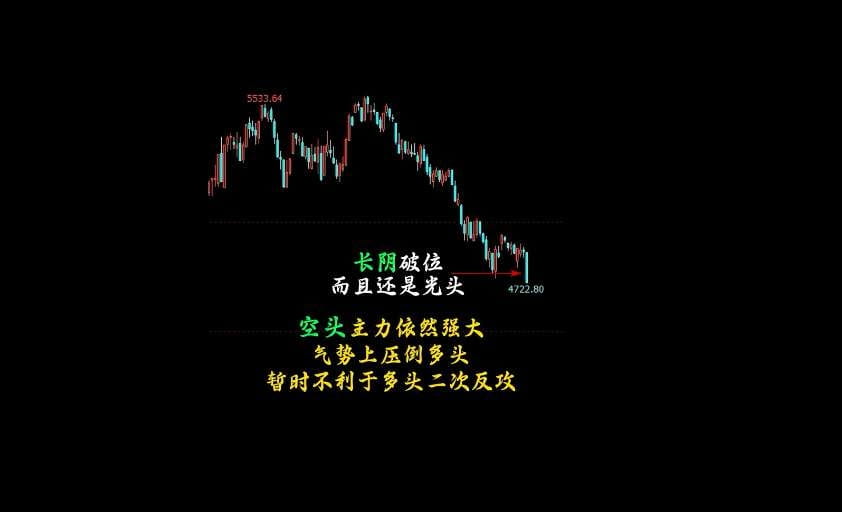
The long shadow breaks, and it is still bald. The main force of the short position is still strong, in fact, it overwhelms the long position, which is temporarily not conducive to the second counterattack of the long position.
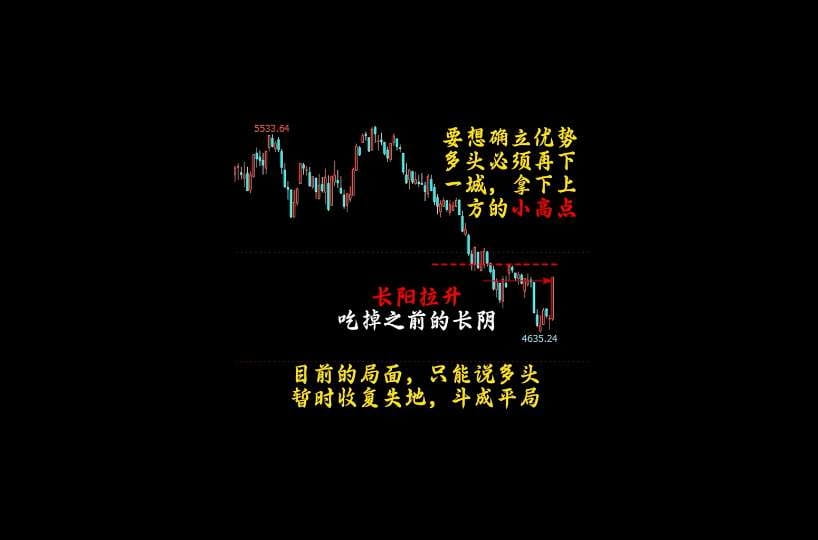
To establish an advantage, the bulls must take another step and take the small high point above
Note: Long Yang pulls up and eats up the previous long Yin
In the current situation, we can only say that the bulls have temporarily regained lost ground and the game has ended in a draw!
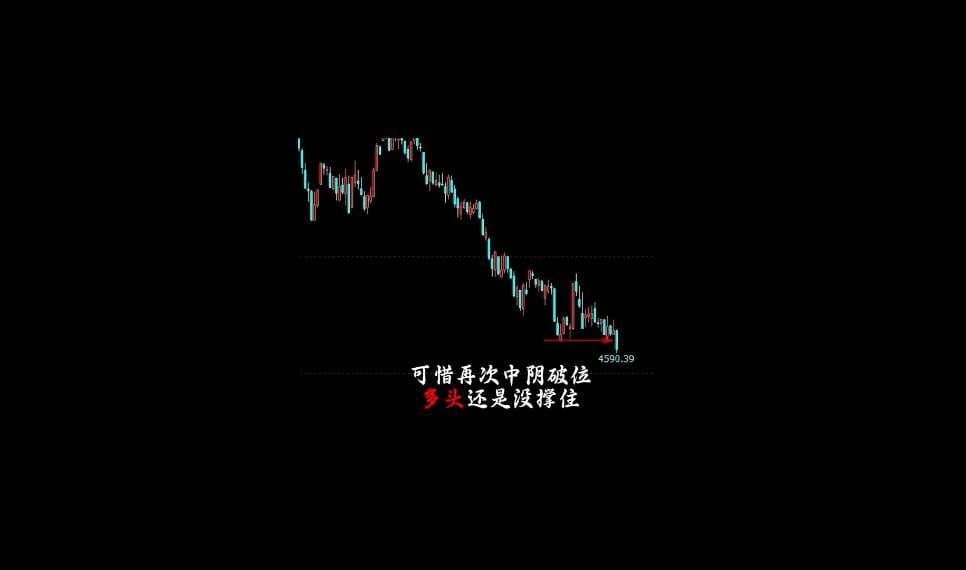
The picture below⬇️ Unfortunately, the middle-yin broke again and the bulls still couldn’t hold on!
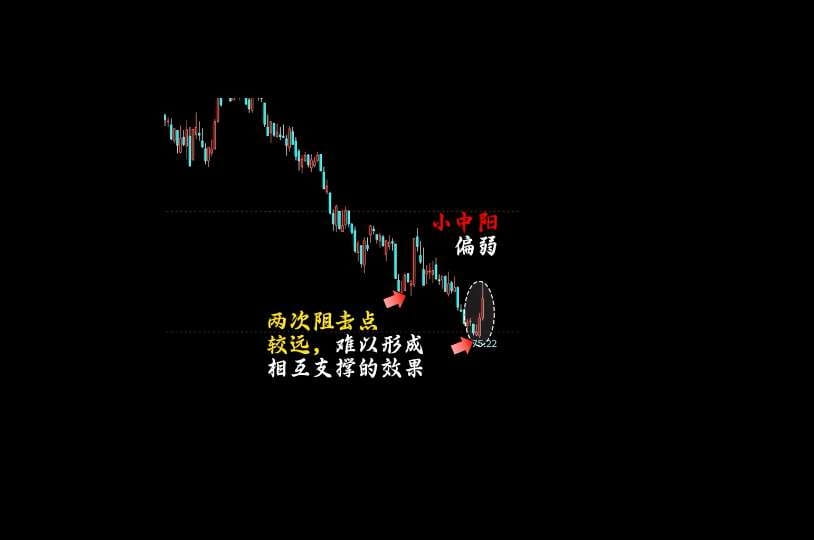
The picture below⬇️Small medium Yang = weak
The two sniper points are far apart, making it difficult to form a mutual support effect!
Below picture ⬇️
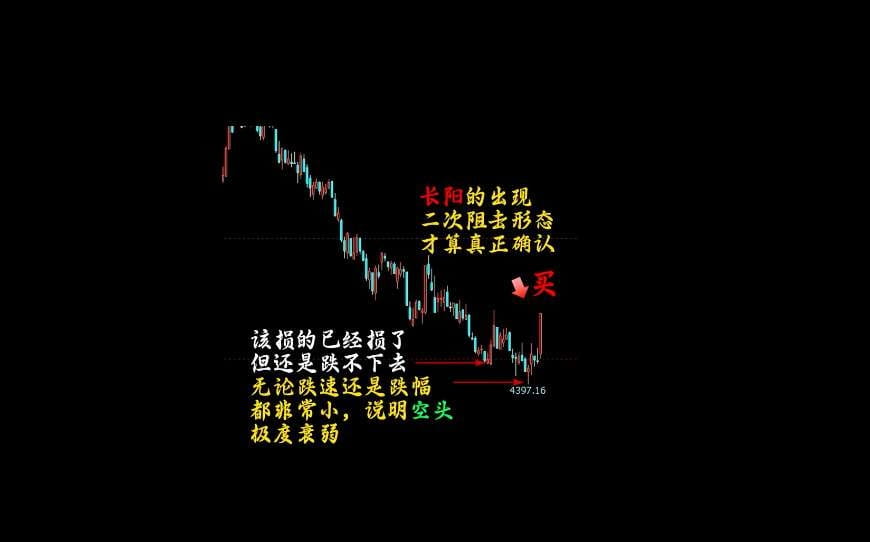
The appearance of Changyang is the real confirmation of the second sniper pattern.
However, the losses that should have been made have already been made, but the price still cannot fall any further.
Both the speed and the magnitude of the decline are very small, indicating that the short position is extremely weak.
Secondary sniper mode:
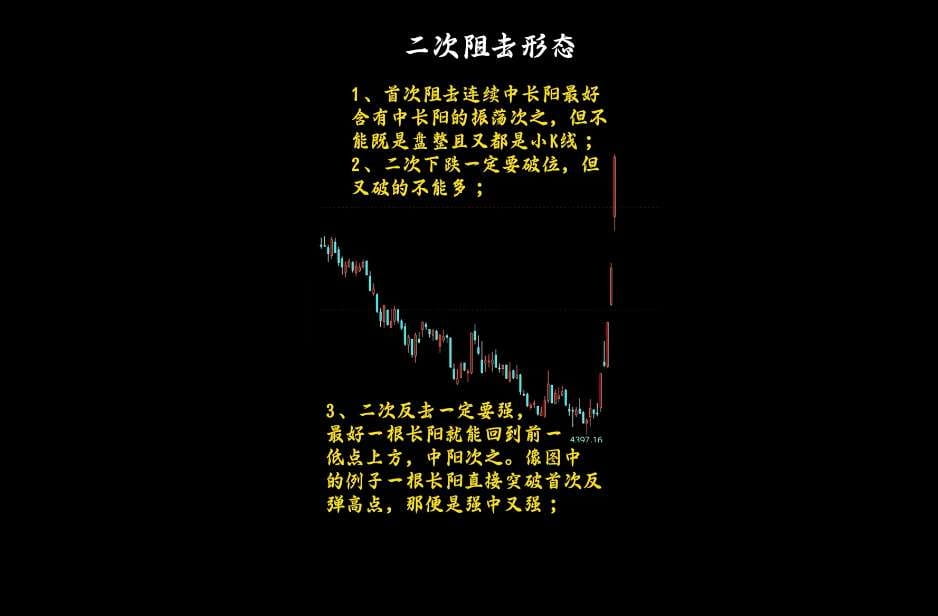
1. For the first attack, it is best to have a continuous medium-long Yang with a shock, but it cannot be both a consolidation and a small K line.
2. The second counterattack must be strong. It is best if a long Yang can return to the previous low point, and a medium Yang is second. Like the example in the picture ⬇️, a long Yang directly breaks through the high point of the first rebound, which is strong among the strong!
What is the highest level of cryptocurrency trading?
The market’s rewards and punishments are magnified by leverage and trading, so the market will reward “people of high levels” by multiplying their funds.
For example, humility, self-discipline, courage, hard work, patience, calmness, etc. At the same time, the market will double punish "people of low level".
For example, greed, fear, impulse, impetuousness, arrogance, laziness, etc. can all lead to bad results in transactions.
So what is the highest level of cryptocurrency trading?
Let's take a look at the views of industry leaders:
Shi Jintao:
If you want to buy coins, buy the best ones. If you can’t afford one Bitcoin, I will ask you to buy 0.1. If Bitcoin fails, what will happen to other coins?
Buying altcoins is all about gambling. Although wealth and honor come with risk, some gambling goes against common sense. I will habitually avoid it. Except for Bitcoin, no coin is worth your all-in.
My operation is:
Just charge, don’t withdraw.
One rush per month.
Pay as soon as salary arrives.
Put the coins into a cold wallet, keep the private key safe, and you will get a stable return of 80% over the years.
kk :
Let me put it this way, a novice cryptocurrency trader will keep opening the exchange and watching the price every minute. If the price doesn’t go up within 5 minutes after buying it, he will immediately get anxious and start to doubt whether the coin is viable. He will then sell it and buy other coins. As a result, he will have less money left over from going back and forth, and it will all be contributed to the transaction fees.
Experts in cryptocurrency trading set a target and invest in a certain coin. They don’t care about the whole thing at all. They just take a look at it when they remember it, and basically they don’t look at it many times a month. Once they buy a coin, they hold on to it and will not make any other operations. No matter whether the price goes up or down, they only invest in it and don’t do anything else.
Over time, you will find that novices die from frequent trading and bottom fishing and high chasing, while veterans are as steady as old dogs, with a terrifyingly low cost price, yet they still hold their positions.
Therefore, the highest level is to buy and forget, be prepared to hold for a long time, and don’t think about anything else.
cone:
To put it simply, it is not hype. My dear brothers and sisters, let me make a bold assumption that everyone has read martial arts novels by writers such as Jin Yong or Gu Long. You should know that the most powerful martial arts in martial arts stories is "no moves are better than moves."
According to Jin Yong's novels, the levels of swordsmanship are as follows: "sharp sword, soft sword, heavy sword, wooden sword, no sword". The most powerful swordsmanship is no sword, because in the end, you don't need to have any moves or a sword.
Gu Du Qiu Bai said that "the grass, wood, bamboo and stone can all be swords", which is a kind of swordless sword. "Six Meridians Divine Sword" is a kind of swordless sword, and Dongfang Bubai's "Embroidery Needle" is also a kind of swordless sword.
To make a simple analogy, the matchlock, Gatling, submachine gun, cannon, and landmine are also a kind of swordless and skillless weapon. It can definitely beat you, so is it a high skill, a kind of swordsmanship?
Being and non-being are mutually convertible, a transformation from one dimension to another.
The end or highest state of dimension A must be the beginning or lowest state of dimension B. When you stand in dimension B and look at things in dimension A, it is just like a human watching ants moving, simple and clear.
This is a dimensionality reduction attack.
No sword strikes at swords, no moves strikes at moves. Why can it strike? Because it jumps to another dimension, striking at the dimension of "existence" from the dimension of "nothingness".
In example:
The highest level of the college entrance examination is not to take the exam, that is, "admission by recommendation". Is that convincing?
The highest level of involution is not to involute, that is, to be smooth. Can it convince people?
The highest level of stock trading is not to trade at all, such as insider trading. Is that convincing?
The highest level of gold panning is not to pan at all, such as selling shovels, water, and jeans. Can you convince people?
What is not fried?
For example, in the primary market, for fixed investment, or for hoarding coins, their trading plans are not based on intraday trading, but outside the market. This is a kind of non-speculation.
Compared with short-term and intraday contract trading, this is a complete dimensionality reduction attack.
Jun:
The highest level of cryptocurrency speculation is to hoard coins, and only hoard Bitcoin and Ethereum!
Just this one sentence, if you can really do it, then I guarantee that you will make money in the cryptocurrency circle.
Bankruptcy, margin call, withdrawal from the circle, and jumping off a building have nothing to do with you. No matter whether Bitcoin rises or falls in the short term, or how it fluctuates, you will remain calm and look at life with a smile.
Because you know that the essence of finance is the exchange of value across time and space, short-term profits and losses are of little significance.
Unless you have been in the circle for many years and have retired, you have seen too many people getting rich in a short period of time and then going bankrupt!
You see too many speculators who think they are different from others, you see too many traders who think they are geniuses, they think they are the wolves of Wall Street.
The result was that I lost everything but my pants...
Respect the laws of the market, respect human nature, and respect your opponents. These three respects are the secrets to my success in the cryptocurrency industry for eight years, and they are also what I want to share with you.
Follow the public account [Sunny Day in the Crypto Circle] and you will definitely gain something. Helping others is like helping yourself. I hope that no matter how the market changes, we can always go on together and still be able to laugh at the cryptocurrency circle ten years later.

