

Preface
This week, the market focuses on whether BTC will enter a false breakout structure at the weekly level again. Since hitting a record high of $111,600, the closing price has fallen back below $109,800, forming a 2B rule structure, which is exactly the same as the starting point of the broken bull market structure in 2021. If it cannot effectively stand back in the pressure zone in the next few weeks, the continuation of the bull market will face major challenges. At the same time, ETH is also facing the pressure of 2,900 and has failed to break through. The bull trend is in jeopardy, and the overall market structure has once again reached a critical junction.
Tether
USDT Market Share
Continuing from last week’s analysis, this week we will use another angle to judge the possible trend of USDT’s market share. First, on the TV chart, we can choose to change the presentation of the chart from K-line to line chart. Generally speaking, the line chart records the price trend between each opening and closing. Compared with the K-line, the opening and closing are easier to see the pattern or important support and resistance. As shown in the figure above, the upper left corner is compressed, forming a triangular convergence, while the lower right corner is an oscillation range with an obvious support and resistance conversion (yellow line). In terms of trend, the current market share of USDT has rebounded slightly after encountering support. If a clear bottom is formed on the yellow line in the future, it is expected to continue to rise.

Bitcoin
MicroStrategy buys BTC
On 2025/05/26, Michael Saylor announced on X (Twitter) that MicroStrategy bought a total of 4,020 BTC this week (average price 106,237).
Currently, MicroStrategy holds a total of 580,250 BTC (average price 69,979)
On-chain operation records: Related links

BTC Market Analysis
BTC's weekly closing reveals an unfavorable situation for the bull market. When observing the trend structure, it can be found that after the previous historical high of 111,600, the weekly K-bar closed again below the high of 109,800 set at the beginning of this year. Such structural performance can be directly regarded as the 2B rule (liquidity hunting). In the past, as long as BTC had a large-scale false breakthrough, the probability of the overall cryptocurrency price performance being slaughtered was greatly increased. Therefore, whether the BTC price performance in the future market has the opportunity to rise again and break through the pressure zone formed by 109,800-111,600 is the most important factor in whether the current bull market can continue.

Regarding the bullish risks brought about by the current structure, Bitcoin taught market participants a profound lesson as early as November 2021. The bullish trend at that time failed to challenge the historical highs set in April 2021 many times, which directly led to the 2B rule (false breakthrough) at the weekly level. The subsequent decline led the currency circle into a year-long bear market cycle.
Although the current time and space background of BTC's growth is different from that in 2021/11, the bullish risks revealed by the current weekly chart are still worthy of attention.

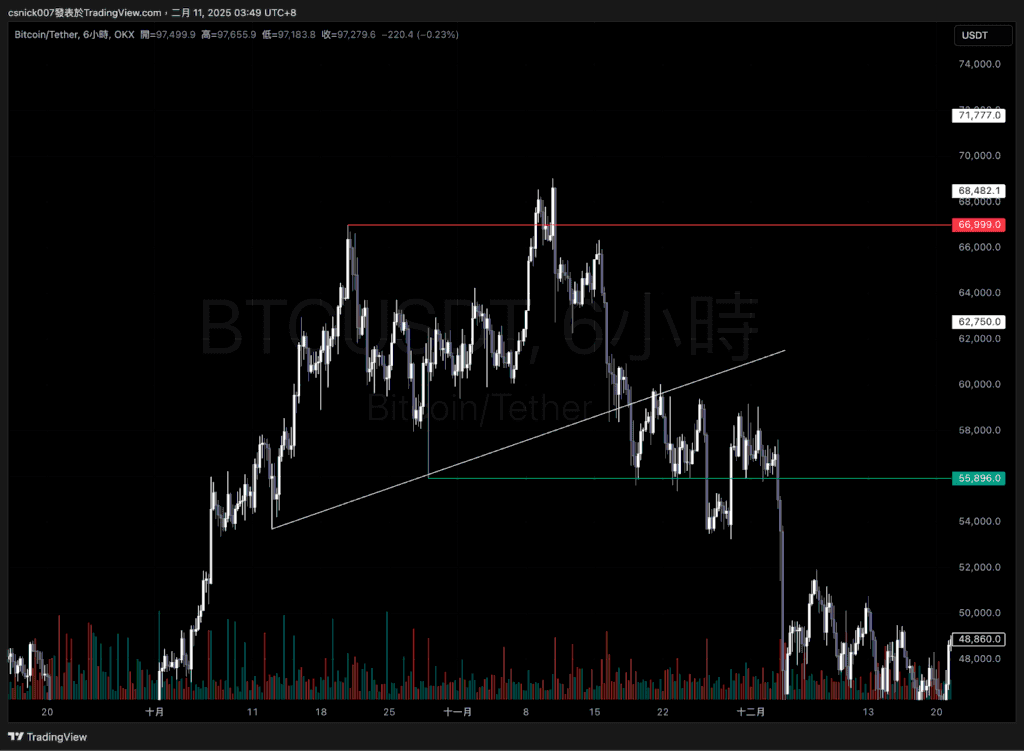
Here we can take a closer look at the weekly test mentioned in the previous paragraph. It was also the 2B rule (false breakout) at the daily level. In the subsequent decline, it did get support at the turning point below (55,896), but the overall bullish trend structure (HL) and the support line were broken, confirming the weekly false breakout mentioned in the previous paragraph.
We can also refer to the structural trend formed from 2023/04 to 2023/10, which also experienced a false breakthrough at the daily level (2B rule) and a downward correction, and the price of the currency fell to the lowest point below, which just completely satisfied one of the deepest declines that the 2B rule can achieve. The biggest difference in this trend is that after BTC met the short target, it formed a trend structure to support it again.

Therefore, the structural performance of BTC in the four-hour level will be particularly important. What we need to pay attention to is whether there will be a false long breakthrough again if BTC rises strongly again and hits a high of around 110,000, which will lead to the risk of multiple declines after the overall weekly level false breakthrough.

Ethereum
ETH Market Analysis
ETH is still facing a daily pressure range. As long as ETH fails to successfully stand above 2,900 on the daily level, the bullish trend will have a high probability of ending. At this position, it can be found that whenever the price faces a large-scale, high-effective pressure range, the possibility of forming the 2B rule is much higher. This is a very common structural performance in the secondary market of cryptocurrency. Therefore, in addition to paying attention to BTC's closing trend at the weekly level, ETH also needs to pay attention to its structural performance when facing pressure.

Altcoin
Hashed transfers SAND to Binance
On 2025/05/26, the address starting with 0xf1d (Hash) transferred 18.454M to Binance.
On-chain operation records: Related links

PEPE Whale Sold
On 2025/05/31, the address starting with 0x3c9E transferred 2T PEPE to Binance.
On-chain operation records: Related links

Conclusion
This week's closing pattern formed a classic 2B false breakout structure. If BTC cannot regain 109,800 in the short term and continue to rise, the weekly high is likely to become the structural end point of this bull market. Historical experience shows that once the weekly high cannot be continued and is accompanied by two consecutive weeks of inability to make up, the market often enters a long-term retracement phase. ETH is still stuck below the pressure level of 2,900, and the momentum continues to decrease, with no signs of an effective breakthrough. If the bulls cannot stabilize quickly, the current rebound may not escape the fate of turning downward.
This report is for information sharing purposes only and does not constitute any form of investment advice or decision-making basis. The data, analysis and opinions cited in this report are based on the author's research and public sources, and may be uncertain or change at any time. Readers should make prudent investment decisions based on their own circumstances and risk tolerance. If further guidance is required, it is recommended to seek professional advice.
