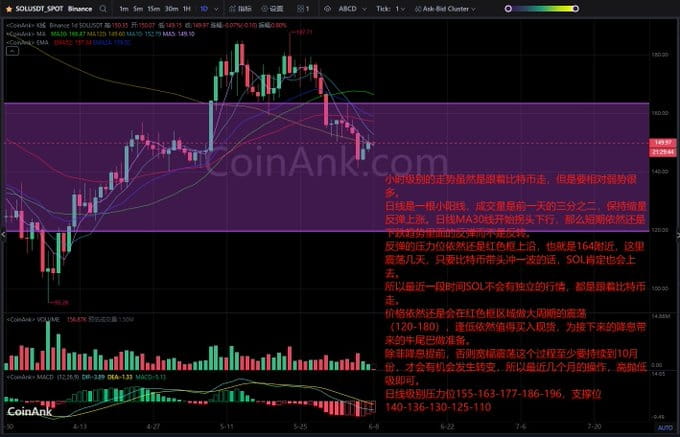
Although the hourly trend follows Bitcoin, it is relatively much weaker.
The daily line shows a small bullish candle, and the trading volume is two-thirds of the previous day, maintaining a shrinking rebound. The daily MA30 line has started to turn downwards, so in the short term, it is still a rebound within a downward trend rather than a reversal.
The resistance level for the rebound remains at the upper edge of the red box, around 164. If Bitcoin leads a rally here after a few days of consolidation, SOL will definitely go up as well.
Therefore, in the recent period, SOL will not have an independent market trend and will follow Bitcoin.
The price will still oscillate in the red box area for a large cycle (120-180). Buying spot at lows is still worthwhile to prepare for the bullish tail brought by the upcoming interest rate cuts.
Unless interest rates are cut earlier, this process of wide oscillation will last at least until October before a change can occur, so the operations in the recent months should just be to buy high and sell low.
Daily level resistance at 155-163-177-186-196, support at 140-136-130-125-110
From the liquidation heat map of SOL, we can see
the price is rising, with a large number of significant and super-sized short positions waiting for liquidation in the 151.6-158 area
the price is falling, with a large number of significant and super-sized long positions waiting for liquidation in the 148.8-141.8 area


