Let’s do some basic analysis and find out.
Based on the 1D timeframe technical indicators and recent price action around the $100,000–$105,333 range, here’s a short-term outlook:
Key Observations
1. Price Action
BTC hit a low just above $100,000, and bounced strongly, suggesting psychological support at that level.
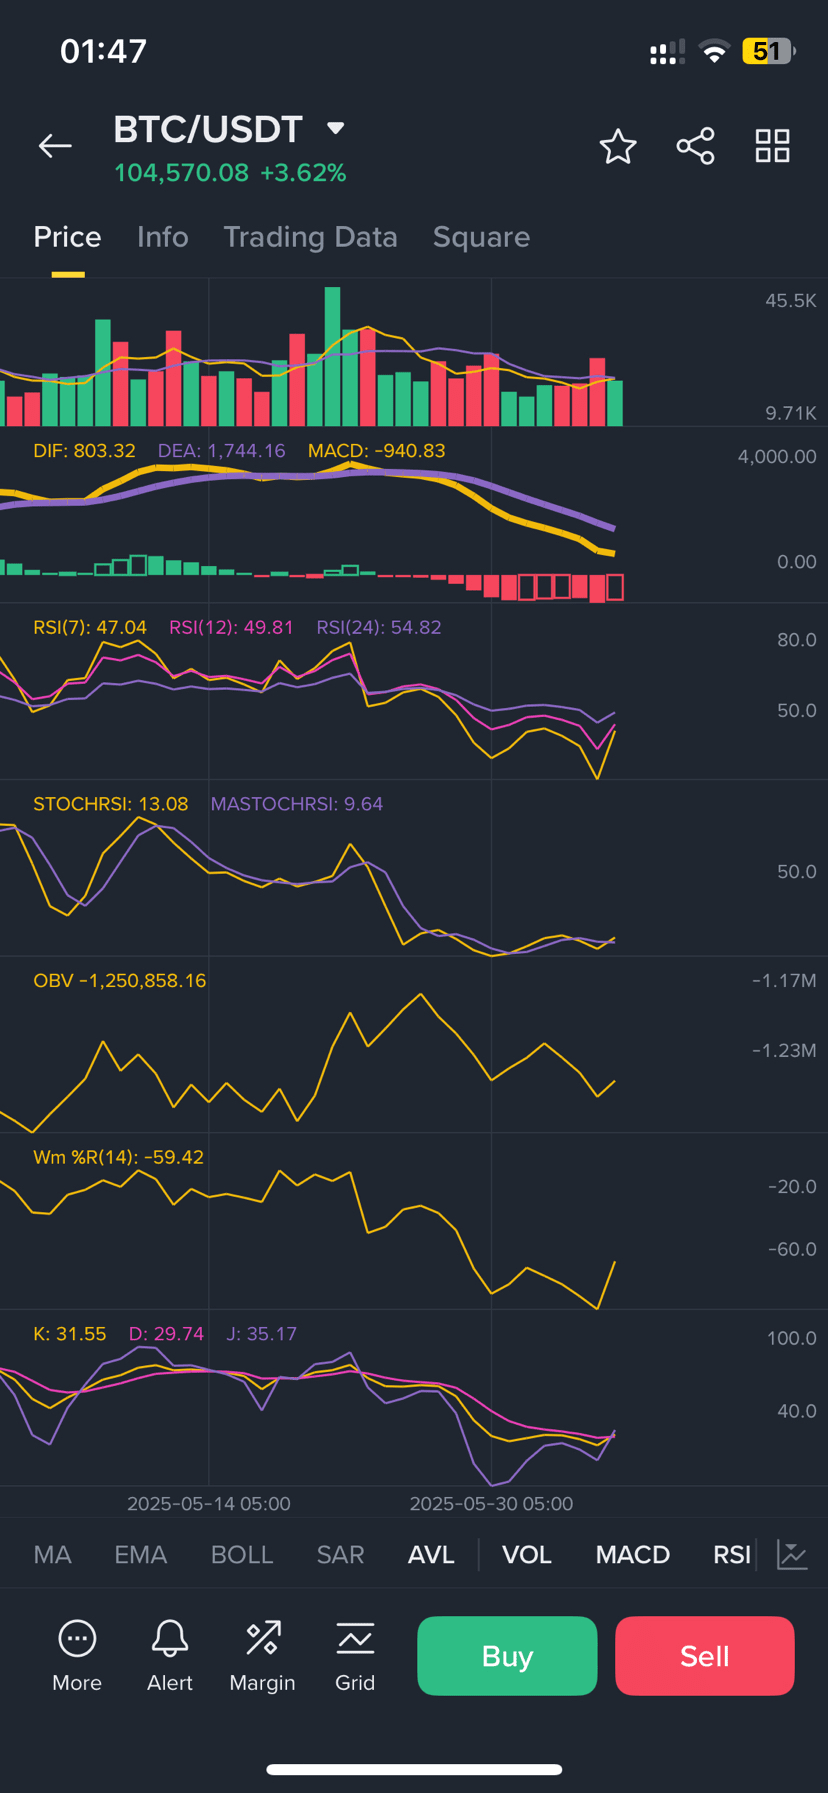
Current price is $104,570 (+3.62%), indicating some bullish recovery.
2. MACD
MACD line (DIF) is below the signal line (DEA) and negative:
DIF: 803.32
DEA: 1,744.16
MACD histogram: -940.83
This shows bearish momentum, but the histogram is starting to flatten, which could indicate weakening bearish pressure.
3. RSI (Relative Strength Index)
RSI(7): 47.04
RSI(12): 49.81
RSI(24): 54.82
Neutral zone - price is not overbought or oversold, but close to mid-range, suggesting indecision. RSI(24) being higher hints at slight longer-term bullish bias.
4. Stochastic RSI
STOCHRSI: 13.08
MASTOCHRSI: 9.64
Deep in the oversold zone (<20) possible reversal signal if it starts to turn up.
5. Williams %R
Wm %R: -59.42
In the middle range, not giving a strong buy/sell signal on its own, but not oversold.
6. KDJ Indicator
K: 31.55, D: 29.74, J: 35.17
Slight bullish crossover between K and D lines, which can sometimes precede an upward move.
7. OBV (On-Balance Volume)
OBV is still negative and trending down, indicating low conviction from volume side despite price bounce.
Short-Term Outlook
Bullish Signals:
Bounce off $100K is strong; psychological support held.
STOCHRSI and KDJ indicate possible short-term bottom formation.
RSI values near mid-levels, with some positive divergence potential.
Bearish Risks
MACD still in bearish territory.
OBV isn’t showing strong accumulation (maybe due to weekend)
No breakout volume yet.
The real Question? Will BTC Dip Below $100K?
Unlikely in the immediate short term (next few days) unless:
Macro news drives strong sell-off (e.g., rate hike, ETF dump, etc.).
$104K–$105K area becomes a strong rejection zone again.
If $BTC fails to reclaim and hold above $105,333, then
$100,000 may be retested.
If broken with volume, next supports would be around $97,000–$98,000.
Summary:
Bias: Cautiously bullish short term (1–3 days) due to oversold signals and bounce.
Key Support: $100,000
Key Resistance: $105,333+
Invalidation: Break and close below $100K with high volume = bearish continuation.
I feel we may not see BTC falling under $100K soon, But everything is possible in this market
 #MarketSentimentToday #TradingSignals #btc

