$PEPE quick technical breakdown of the PEPE/USDT trading pair on the 1-hour timeframe – perfect for short-term traders.
🔍 Key Market Data
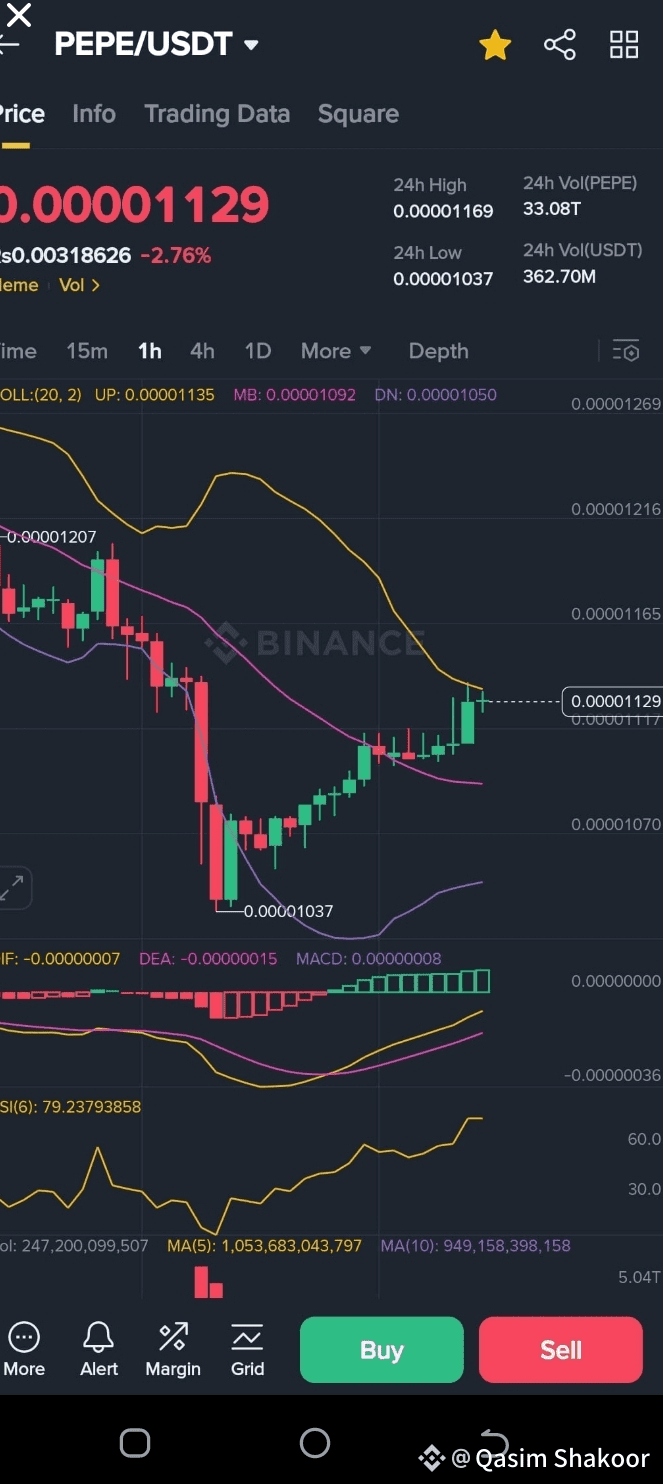
Current Price: 0.00001129 USDT
24h High: 0.00001169
24h Low: 0.00001037
24h Volume (PEPE): 33.08T
24h Volume (USDT): 362.70M
📈 Technical Indicators
1. Bollinger Bands
Upper Band: 0.00001135
Middle Band: 0.00001092
Lower Band: 0.00001050
💡 Insight: Price is nearing the upper band, signaling either an overbought condition or a potential breakout.
2. MACD
MACD Line: -0.000000008
Signal Line (DEA): -0.000000015
DIF: -0.000000007
Histogram: Turning positive
💡 Insight: A bullish crossover is forming – momentum may be shifting upward.
3. RSI (6)
RSI Value: 79.23
💡 Insight: RSI is deep in the overbought zone, which could mean a temporary pullback unless bulls push further.
📊 Volume & Moving Averages
MA(5): 1,053T
Ma(10): 949T
Volume: Recent spikes indicate strong buying pressure.
---
🧠 Summary
✅ Bullish Signals
Bullish MACD crossover
Price hovering above the mid-Bollinger band
High trading volume
⚠️ Caution
RSI in overbought territory — a short-term correction could follow
---
📣 Want next-level insights?
Drop a comment if you'd like a
breakdown of upcoming support/resistance levels or price targets based on this setup!