At the time of writing, Bitcoin has slightly decreased to near the mark of $104,800, while Ethereum and XRP are facing weakness in bullish momentum. Both BTC and XRP are currently approaching important crossroads at technical support areas, while Ethereum is still in a consolidation phase, facing the risk of a deeper bearish adjustment if the negative trend continues to spread.
Bitcoin is at risk of a sharp decline to $100,000
Today, the price of Bitcoin shows signs of a slight adjustment, dropping from the daily high of $105,240 to $104,546 at the moment. With two consecutive sessions of bearish candles appearing on the daily chart, BTC has lost nearly 1% in value since the beginning of the week.
The current price action of the world's largest cryptocurrency is sending warning signals about a deeper correction, as the Head and Shoulders pattern begins to form clearly. The neckline at $102,315 is an important support level; if Bitcoin closes daily below this level, the possibility of dropping to $100,000 will become very clear.
In the event that the downward trend continues, the nearest support level will be the 50-day exponential moving average (EMA) around $100,946.

BTC 1-day price chart | Source: TradingView
Momentum indicators are also supporting a bearish scenario. The Relative Strength Index (RSI) currently stands at 50, marking the second time it has hit the neutral threshold since last Friday, indicating weakening buying pressure and plenty of room for prices to continue adjusting. At the same time, the Moving Average Convergence Divergence (MACD) indicator has just signaled a decrease as the moving averages approach the centerline following a recent crossover.
However, if Bitcoin can bounce back and surpass the weekly high of $106,794, the bearish pattern will be invalidated. In this positive scenario, prices could aim for a new target at the current historic peak, around $111,980.
Ethereum continues to consolidate
Ethereum did not record significant price fluctuations on Thursday, after a long Doji candle on Wednesday marked a reversal from the level of $2,679. This continues to prolong ETH's consolidation phase as the price remains above the gains from early May, staying above the 200-day EMA at $2,462.
However, the largest altcoin has experienced five failures to maintain closing above the $2,700 level. Each price increase has been accompanied by the RSI on the daily frame creating lower peaks, reflecting a clear weakening of bullish momentum. This is a sign of bearish divergence, warning of the potential for a trend reversal in Ethereum.
On the other hand, positive signals come from the bullish crossover between the 50-day EMA and the 100-day EMA, reinforcing the possibility of a recovery trend occurring.
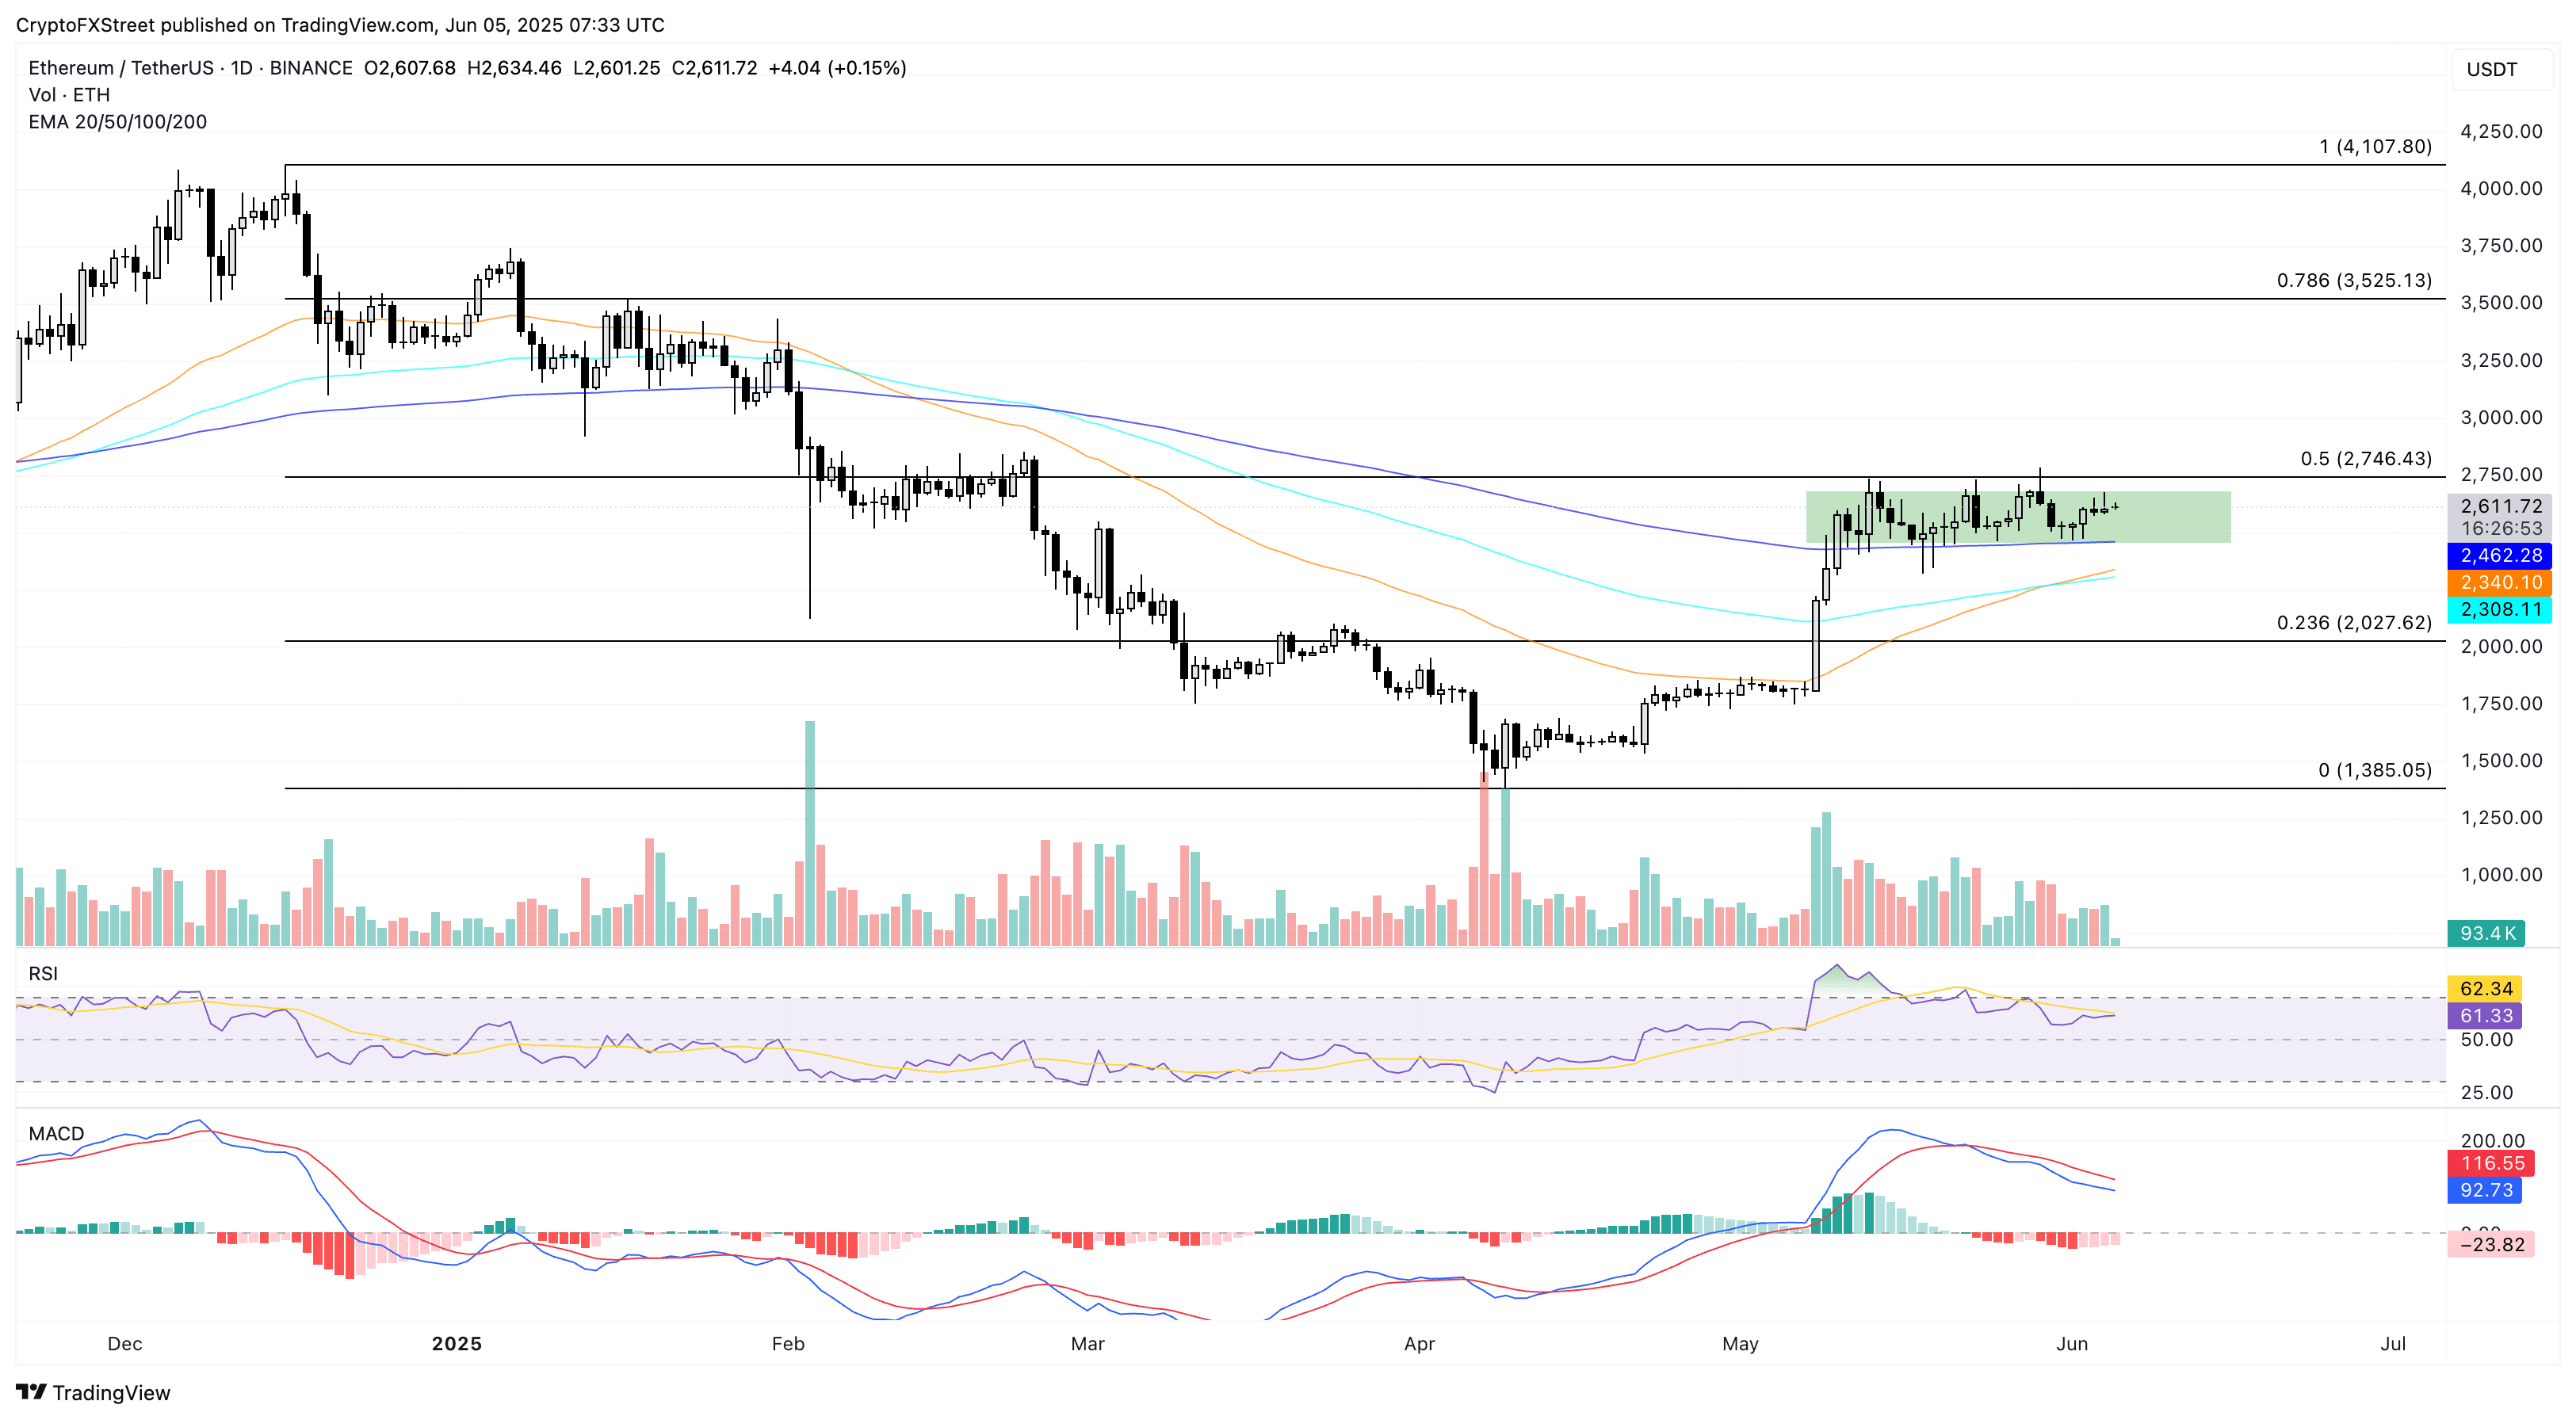
ETH 1-day price chart | Source: TradingView
If the price can break out strongly and close above the $2,700 threshold, Ethereum may challenge the 78.6% Fibonacci retracement level at $3,525 — calculated based on the high price region of December ($4,107) and the low of April ($1,385).
Conversely, the important support level remains the 200-day EMA at $2,462. If Ethereum closes below this threshold, it is likely to retest the 50-day EMA around $2,340.
XRP is at risk of losing the 200-day EMA support level
XRP is facing the risk of losing the important support level at the 200-day EMA. Following a 1.95% drop on Wednesday, XRP continues to weaken by over 0.50% on Thursday. The price has now fallen below the $2.20 mark, raising traders' concerns about the potential failure to confirm bullish momentum through the triangle pattern on the daily chart — a pattern formed from the highs of January, March, and May along with the lows of April and early May.
This altcoin is being squeezed between the 200-day EMA at $2.08 and two 50-day EMAs ($2.27) along with the 100-day EMA ($2.26) which are gradually decreasing, reflecting the difficulty in regaining bullish momentum. Technical indicators also show that selling pressure is increasing: both the MACD line and the signal line are plunging into the negative zone, while the RSI has turned down from the neutral threshold, reinforcing the downward trend.
If the price closes below the 200-day EMA, XRP's correction may extend deeper, heading towards the level of $1.79 — the lowest closing price in April.
However, if XRP overcomes the general market pressure and bounces back above the 50-day EMA, the price level of $2.58, equivalent to the highest closing peak of May, will be the next target to challenge.

XRP 1-day price chart | Source: TradingView
Currently, the crypto market is undergoing a technical adjustment with mixed signals from indicators and price patterns. Bitcoin and XRP are approaching key support levels, while Ethereum, despite maintaining the main support area, shows bearish divergence warning of a reversal risk.
In the current sensitive market context, investors need to closely monitor these important technical milestones to make appropriate decisions. A significant breakout or breakdown may determine the market trend in the coming weeks.
https://tapchibitcoin.io/bitcoin-truot-ve-100k-eth-hop-nhat-xrp-doi-mat-ho-tro.html
