Hello, Binance Square family! 👋
Dogecoin (DOGE) is currently exhibiting signs of potential bearish movement on the 4-hour chart. Let's delve into the technical analysis to understand the possible scenarios and trading strategies.
---
📊 Current Market Snapshot
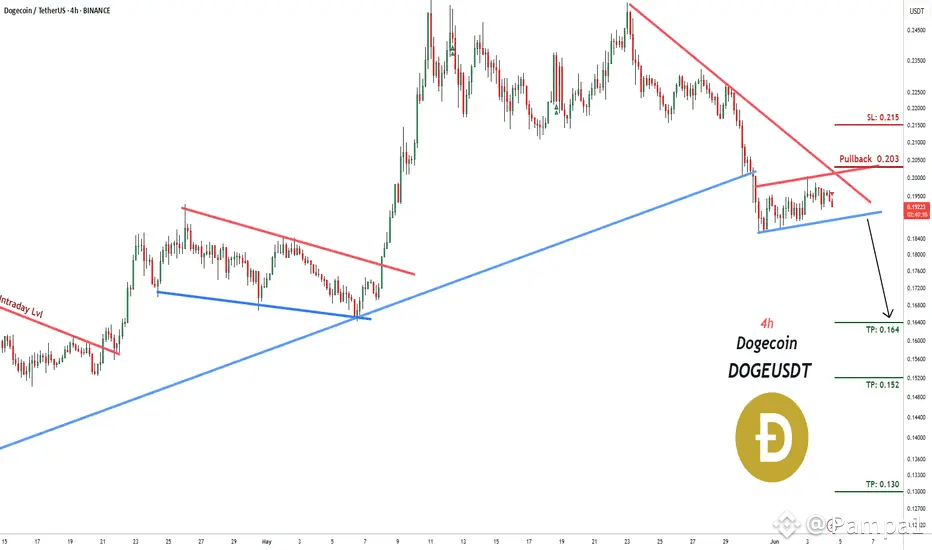
Current Price: $0.1925
24h Change: -1.75%
Intraday Range: $0.1925 – $0.1979
---
🔍 Technical Overview
🔹 Bearish Indicators
Descending Triangle Formation: DOGE is forming a descending triangle, typically a bearish pattern, suggesting potential for a downward breakout.
Resistance Levels: The price has faced repeated rejections near the $0.1970–$0.1990 zone, indicating strong resistance.
Volume Analysis: Decreasing trading volume during recent price consolidations hints at weakening bullish momentum.
🔹 Support Levels
Immediate Support: $0.1880 – A breakdown below this level could trigger further selling pressure.
Secondary Support: $0.1800 – If the price breaches the immediate support, this level may act as the next potential halt for the decline.
---
🎯 Trading Strategy
Short Position Entry: Consider entering a short position if the price breaks below $0.1880 with increased volume.
Stop Loss: Place a stop loss above the $0.1970 resistance to manage risk.
Take Profit Targets:
First Target: $0.1800
Second Target: $0.1700
---
⚠️ Risk Management Tips
Confirmation: Wait for a confirmed breakout below support levels before entering a trade.
Position Sizing: Use appropriate position sizes to manage risk effectively.
Stay Informed: Keep an eye on market news and updates that could impact DOGE's price.
---
📌 Final Thoughts
While Dogecoin shows signs of potential bearish movement, market conditions can change rapidly. Traders should remain vigilant, use proper risk management, and stay updated with market developments.
Happy trading, and stay safe! 🚀📈
---
*Disclaimer: This analysis is for informational purposes only and does not constitute financial advice. Always conduct your own research and consult with a financial advisor before making investment decisions.*
