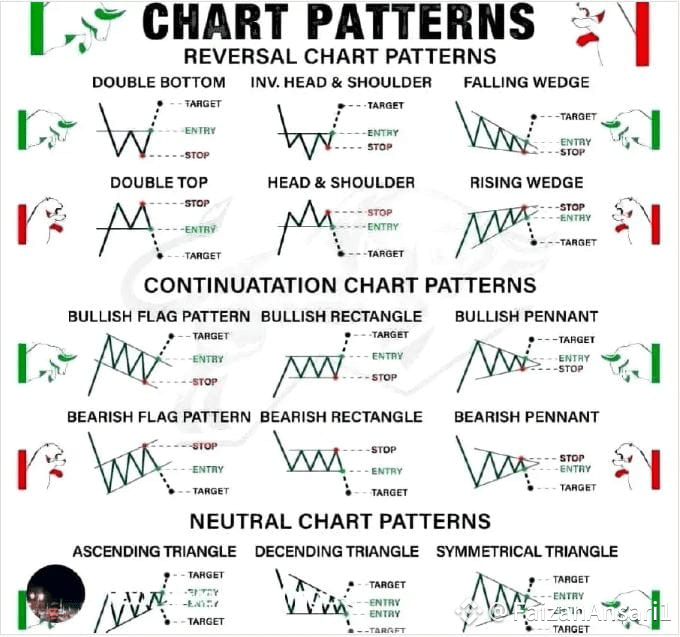
This image shows various types of chart patterns used in technical analysis for trading. Let me explain them in simple terms:
Reversal Chart Patterns (Signal trend changes)
Double Bottom (W-shaped):
Bullish reversal pattern after downtrend
Entry: When price breaks above middle peak
Stop: Below the lowest point
Target: Height of pattern projected upward
Inverse Head & Shoulders:
Bullish reversal (left shoulder, lower head, right shoulder)
Entry: Break above neckline
Stop: Below head's low
Target: Head to neckline distance projected up
Falling Wedge:
Bullish reversal (price makes lower highs/lows but converging)
Entry: Break above upper trendline
Stop: Below pattern
Target: Height of wedge base projected up
Double Top (M-shaped):
Bearish reversal after uptrend
Entry: When price breaks below middle trough
Stop: Above highest point
Target: Height of pattern projected downward
Head & Shoulders:
Bearish reversal (left shoulder, higher head, right shoulder)
Entry: Break below neckline
Stop: Above head's high
Target: Head to neckline distance projected down
Rising Wedge:
Bearish reversal (price makes higher highs/lows but converging)
Entry: Break below lower trendline
Stop: Above pattern
Target: Height of wedge base projected down
Continuation Patterns (Trend pauses then continues)
Bullish Flag/Pennant/Rectangle:
Brief consolidation in uptrend
Entry: Break above pattern
Stop: Below pattern
Target: Height of prior move projected up
Bearish Flag/Pennant/Rectangle:
Brief consolidation in downtrend
Entry: Break below pattern
Stop: Above pattern
Target: Height of prior move projected down
Neutral Patterns (Can break either way)
Ascending Triangle:
Flat top, rising bottoms
Typically bullish break above resistance
Descending Triangle:
Flat bottom, lowering tops
Typically bearish break below support
Symmetrical Triangle:
Converging highs and lows
Break direction determines trend
Key points:
Entry: Where to enter the trade
Stop: Where to place stop-loss
Target: Where to take profits
Patterns work best with volume confirmation
Always use stop-losses as patterns can fail.