What is the Doji candle, and what’s the psychology behind it? Not just indecision and struggle—discover more.
Disclaimer: The content in this article is for informational and educational purposes only. It reflects my personal views and analysis of market psychology, price action, and trading strategies but should not be considered financial, investment, or trading advice.
If you're in trading, I know for sure that you've stumbled across many definitions of the standard long-legged Doji candle. I'm calling it "standard" to refer to the classical cross Doji with long tails and the open and close price almost equal in the middle.
For sure, you've read that it is a sign of market indecision and that when you see it, you know that buyers and sellers are struggling.
I think these definitions don’t tell you much about the Doji, which is actually one of the most talkative candles in trading.
Often, an important piece of information is missing: volume.
We're going to focus on price and volume—because there is no reason to overcomplicate things, and because price and volume are, most of the time, the only two elements you need to understand what's going on.
Moreover, in crypto trading, we have the advantage of unlimited, public data on both. In short, they never lie.
That’s why I always prefer focusing on these two elements: they’re not subject to different opinions, calculations, complex indicators, and so on. They truly give you a glimpse into what traders are thinking and doing. And understanding the mind of traders is the only skill you need in trading.
That’s why, before moving on to daily updates, long- or short-term strategies, more complex formations, and timing, I want us all to understand the rationale behind each movement. This is the starting point for every successful trade, algorithm, or whatever you want to build.
Now, let's try to understand what a Doji would be like if it happened in real life.
Our character—let’s call him Bill—sees The Bull’s Peak (a pub) and wants to join the bull run. He sees a bunch of people (our market participants) standing in front of the door. Signs that it's a bad idea to enter the pub at that moment are all around, but he is brave and wants to go in anyway. The moment he steps inside, a bunch of people (our bears) flood the street to stop Bill's run, yelling, “No way!”
That’s what happens in the market. Sellers don’t allow buyers to push beyond a certain price point. But this is more than just a struggle—it’s the meeting of two different perspectives.
Sellers are convinced it’s time to push the price lower. Buyers are convinced it’s time to push the price higher. Both apply different reasoning.
If we’re in a rising market, bulls think it’s okay to earn more. In a falling market, they think it’s time for a reversal.
On the other hand, bears might have found signs of weakness, or they think it’s okay to earn more by shorting.
The point is that both sides put in a lot of effort to prove themselves right. That’s why a standard long-legged Doji occurs on high volume.
And that’s not indecision—if it were, you would see low volume. In most cases, if you see something like this on low volume, you're witnessing the creation of a trap—but I’ll leave that for another article.
Once a Doji is formed, you have two options:
Stop acting and just observe
Break it down and decide how to act (this is more for the brave hearts)
How do you break it down?
If you’ve been watching a 1-day candle, you move to the 4-hour chart.
If you’ve been watching a 4-hour candle, you move to the 1-hour chart. And so on. (Don't worry—this reasoning applies to every timeframe.)
Let's see an example.
I chose for you a textbook long-legged Doji—an almost perfect cross on relatively high volume.
This is the $BNB BNBUSDC daily candle (September 24, 2024) on the Binance trading platform.
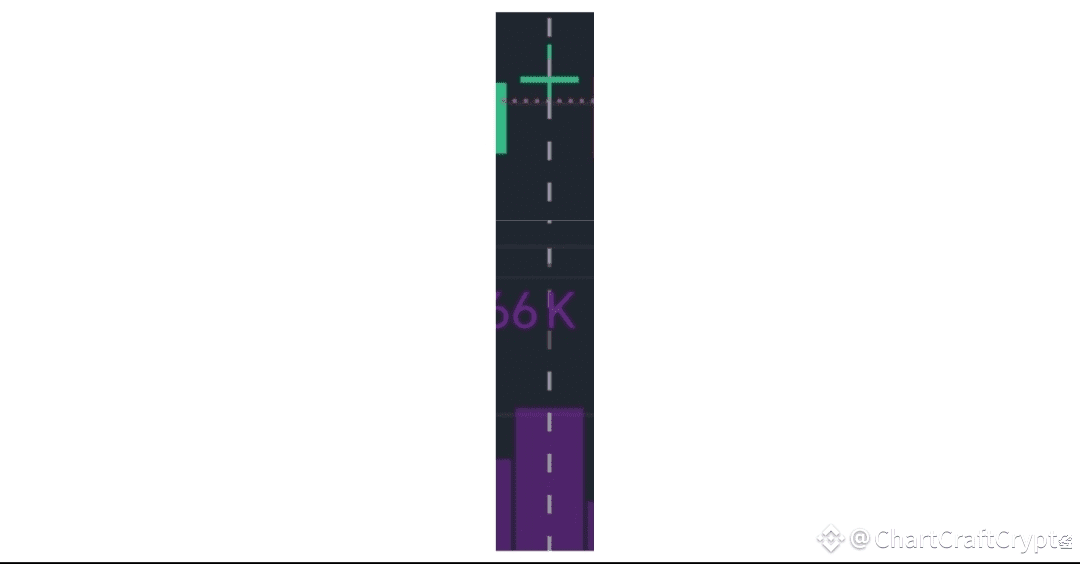
I see this candle, but I don’t know what to do for the next day. So, I decide to break it down.
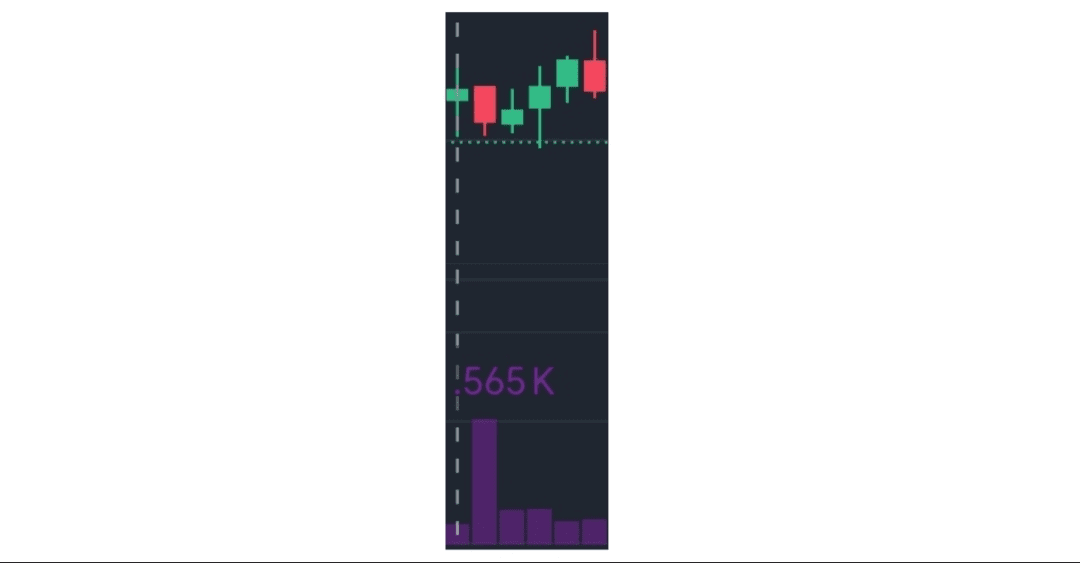
We need to look at six candles, starting from the one marked by the line.
The first candle represents indecision.
Why are traders uncertain? Because the last candle they saw had a long body and short tails, but low volume. (Don't worry if you don’t fully grasp what this means—we have many articles ahead to cover everything.)
For now, what you should know is that traders have reasons to be uncertain. So, the first candle we see is indecision.
The second candle gives us clearer information—bears have entered the market. The volume is very high, but we need more context because their effort didn’t translate into a major price drop. (Again, we’ll cover this in future articles.)
Candles 3, 4, and 5 tell us a lot—this is a classic "three falling methods" pattern. These candles already suggest that the next one will be bearish.
And actually, the last candle of our day is bearish.
Now that I know there were multiple signs of a bearish market throughout the day, I return to my daily candle—our Doji.
Since I’m somewhat of a brave heart (but a responsible one), if I had to trade this candle, I would open a bearish position.
(Don’t take this as financial advice! Our goal here is to understand what traders are thinking, then decide based on our reasoning and risk tolerance.)
And the market would have proved me right, since the next daily candle was bearish.
All of this is just the first step in understanding price movements, without focusing on specific long- or short-term strategies. Take this as an exercise to understand other traders' behavior in the market.
Final Thoughts
It’s important to always be responsible and adapt strategies as needed.
Even though we're talking about the crypto market, manipulation still happens—and one of the biggest drivers of manipulation is news from major outlets.
But the market’s reaction to news is a huge topic—one that we’ll cover in another article.
This was just a first step into traders' minds.
It’s true that no trader can know everything, but it’s also true that traders can learn a lot just by watching the charts.
I hope to see you in the next article!

