The TD Sequential buy signal aligns with bullish sentiment and critical support near $154.
Liquidation clusters and rising derivatives activity indicate imminent price volatility.
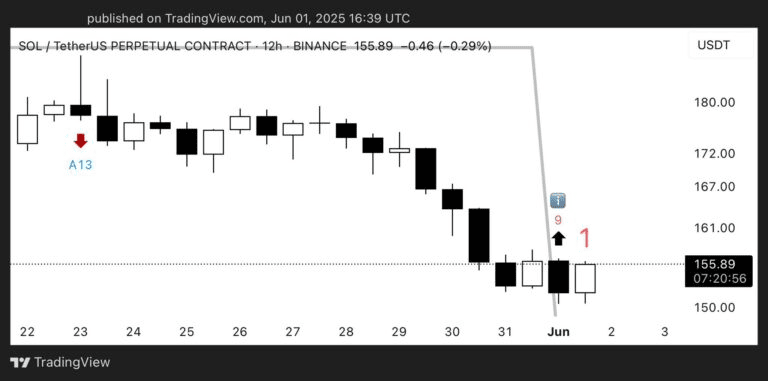
The TD Sequential indicator showed a 'buy' signal of '9' on the 12-hour Solana [SOL] chart, indicating a potential trend reversal after a sharp drop from over $180 to $154.
In addition to the bullish outlook, MarketProphet sentiment shows a positive alignment: public sentiment stabilized at 0.36, while smart investors recorded a rise to 1.31.
This confluence of support, sentiment, and technical indicators may act as a catalyst for recovery after the drop from $180.
SOL Buy Indicator
Source: X/Ali
Does SOL's cautious trading conceal increasing pressure for a breakout?
The derivatives market indicates growing speculative interest in Solana's stock. Trading volume increased by nearly 30% to reach $10.18 billion, while the average open interest (OI) rose by 2.51% to $6.67 billion.
Moreover, the volume of options increased by 45.90%, and the average open interest (OI) rose by 27.35%, indicating strong positioning.
These sharp increases show that traders are preparing for volatility, likely around Solana's support area.
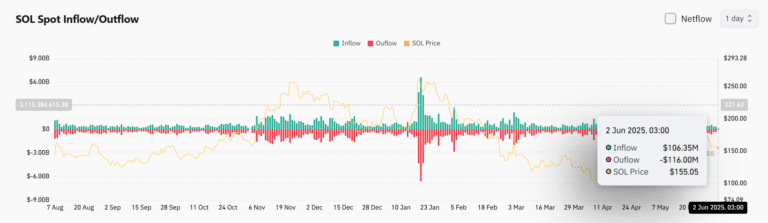
As of this report, spot cash flows recorded inflows of $106.35 million against $116 million outflows, reflecting a net difference of just $10 million. This slight external flow indicates a cautious market, where neither buyers nor sellers dominate.
Despite the negative net figure, the small gap shows hesitation rather than a firm conviction. It seems investors are watching Solana's reaction at current levels before committing heavily.
Source: CoinGlass
Will SOL liquidation clusters near $150 and $160 push...
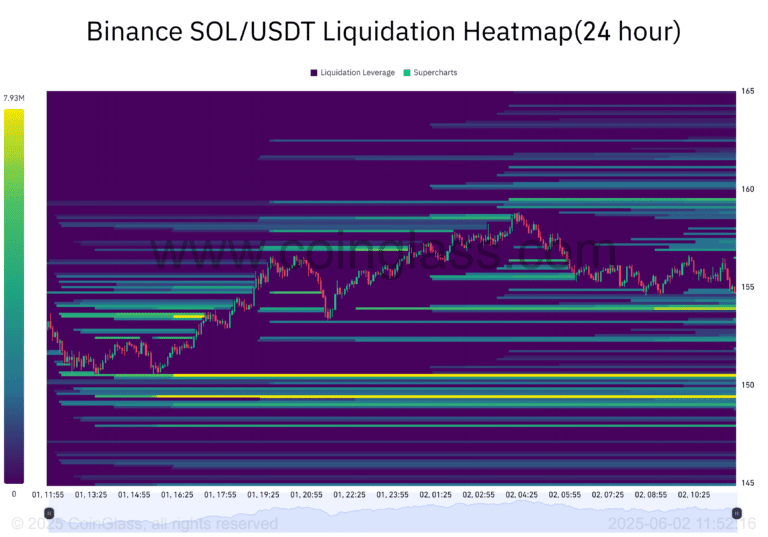
The Binance heatmap shows dense clusters near $150 and $160, which are areas where high leverage positions are concentrated.
These levels now form short-term battlegrounds. A drop below $150 could trigger long liquidations, increasing downward pressure.
Conversely, a rise above $160 could lead to a wave of short liquidations, accelerating any upward move.
Therefore, these clusters represent key pivot points. The price direction around these levels is likely to determine whether SOL regains momentum or retreats further into the downturn.
Source: CoinGlass
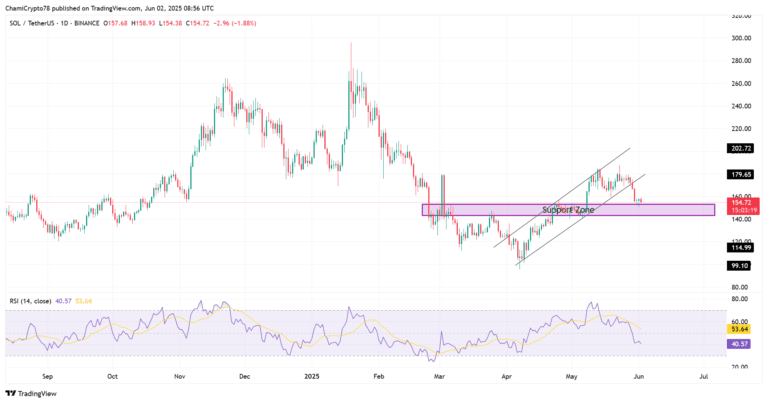
Does the relative strength index (RSI) support the likelihood of a short-term rebound?
At the time of publication, the daily relative strength index stabilized around 40.57, approaching the oversold threshold. This suggests that selling pressure may ease. Meanwhile, Solana broke through its ascending channel, but it remains above the horizontal support level.
This situation suggests a possibility of a higher low if buyers defend this area. However, a lack of commitment could deepen losses toward $140 or lower.
Thus, the movement of the relative strength index (RSI) in the coming days will be crucial - if it reverses upwards, it could bolster the likelihood of a slight rise towards $160.
Technical outlook for Solana
Source: TradingView
Can Solana maintain the support level and regain momentum at $160?
Solana has a real chance to reclaim $160 if current conditions persist. The convergence of the TD Sequential 'buy' signal, increased investor interest in derivatives, and positive sentiment from both smart and retail investors all strengthen the likelihood of a strong short-term recovery.
However, the price must break the $160 level and establish itself above this level to confirm momentum. Until then, the support level at $154 remains critical.
A drop below $150 could invalidate this situation and return control to bearish traders. Therefore, the next move depends on how SOL interacts with these nearby liquidity areas.

