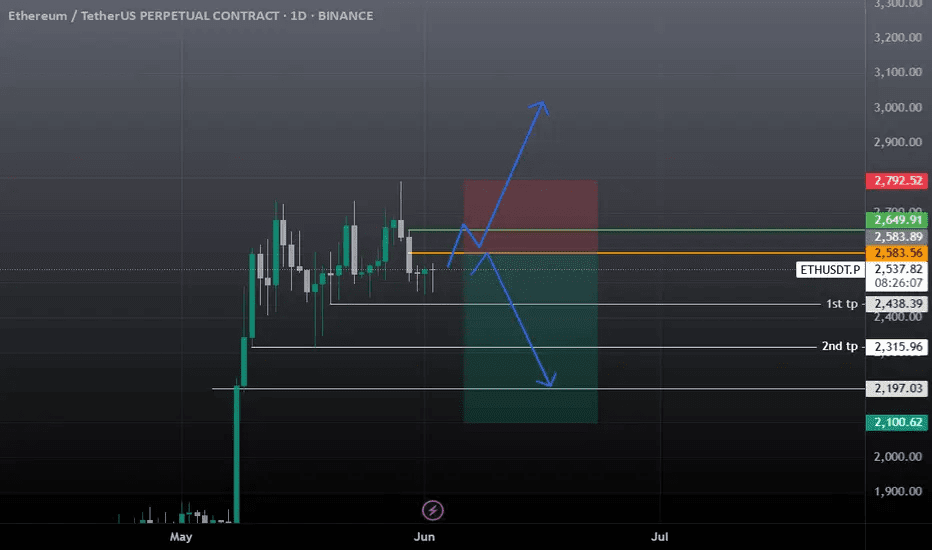
Ethereum (ETH) is currently in a critical phase of its market cycle. Traders and investors are watching key technical levels to determine the next important move. Let's dive into the latest swing trading analysis of ETH/USDT and explore the potential scenarios unfolding.
🔍 Current Market Overview
Current price: around $2,420
Key resistance levels: $2,500, $2,600
Key support levels: $2,300, $2,200
Ethereum has recently pulled back from its previous highs, testing lower support levels. Market sentiment appears cautiously optimistic, with the vast majority of traders on Binance holding long positions. However, the critical question remains: Will ETH break above resistance and resume its upward trend, or will it face further declines?
📊 Technical Analysis
1. Symmetrical Triangle Pattern
ETH/USDT is forming a symmetrical triangle on the 2-hour chart, a pattern that often indicates continuation. A break above the upper limit may signal a bullish move towards $2,600 and beyond. Conversely, a breakdown below the lower limit could lead to a retest of support levels around $2,200.
2. Relative Strength Index (RSI)
The Relative Strength Index is currently at 63.34, indicating that ETH is gaining upward momentum but still has room to grow before reaching overbought conditions. This suggests a healthy upward price movement.
3. Exponential Moving Average (EMA) Bar
The exponential moving average bar is contracting, indicating reduced volatility and potentially signaling a significant price movement. Traders should watch for a critical breakout above the exponential moving average bar to confirm the next trend direction.
📈 Potential Scenarios
✅ Bullish Scenario
Condition: ETH breaks above the resistance level of $2,500 with strong trading volume.
Target: Move towards $2,600 and possibly higher.
Action: Consider entering long positions upon confirmation of the breakout.
⚠️ Bearish Scenario
Condition: ETH fails to break resistance and drops below $2,300.
Target: Re-test support levels around $2,200.
Action: Watch for potential short opportunities if bearish momentum is confirmed.
💡 Trading Strategy
Entry Point: Watch for a breakout above $2,500 or a drop below $2,300.
Stop Loss: Place below the most recent swing low to manage risk.
Take Profit: Set targets at key resistance levels, adjusting based on market conditions.
📌 Final Thoughts
Ethereum's price movements are at a crossroads. Upcoming decisions at key levels are likely to define the next important step. Traders should stay vigilant, manage risks appropriately, and monitor market developments.
*Disclaimer: This analysis is for informational purposes only and does not constitute financial advice. Always conduct your own research before making investment decisions.*
