

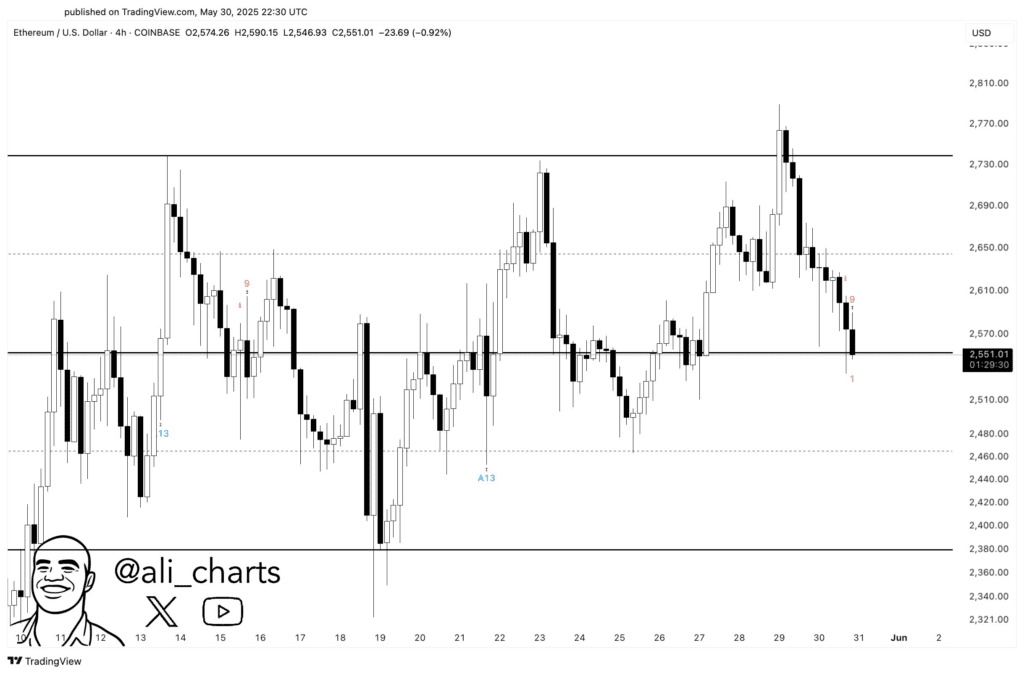
Ethereum’s price tested the $2,550 support level which may stop further decline and start a rebound.
A TD Sequential buy signal appeared on the 4-hour chart indicating potential short-term price strength.
If $2,550 holds, Ethereum could attempt to reach the $2,650 resistance level in the near term.
Ethereum ($ETH) is currently testing a crucial support level at $2,550, signaling potential for a bounce toward $2,650, according to technical analysis by Ali Charts. This movement aligns with a buy signal from the TD Sequential indicator on the 4-hour timeframe, providing traders with a notable point of interest.
 Source: X Key Support at $2,550 Sets Stage for Price Action
The price of Ethereum has declined to $2,551, just above the pivotal $2,550 support. This level has been tested multiple times recently and appears to hold strong against further drops. If $2,550 holds, market momentum could shift positively in the near term.
Chart patterns suggest that a sustained hold above $2,550 could trigger a rebound toward $2,650. This resistance level has acted as a ceiling in previous price swings, marking it as a key target for bullish movement. The presence of the TD Sequential buy signal adds technical weight to this outlook.
The TD Sequential indicator flashed the buy signal at the recent low, typically indicating the end of a bearish phase in short-term trading windows. This technical cue often precedes upward price corrections. The 4-hour chart timeframe, used for this analysis, is critical for intraday and swing traders.
Price Fluctuations Reflect Market Volatility and Resistance
Ethereum's price recently ranged between a high near $2,590 and a low around $2,546. This volatility demonstrates the market’s testing of support and resistance levels within a narrow trading band. The downward movement to just above $2,550 could represent a short-term correction phase.
Resistance near $2,650 remains a significant hurdle for Ethereum. Previous attempts to breach this level have failed, suggesting selling pressure or profit-taking at this price point. A successful breakout above $2,650 would be necessary for further upward momentum.
If the support at $2,550 fails, Ethereum may revisit lower price points near $2,510 or $2,480, as suggested by recent price action. Traders and investors will closely monitor this support level to gauge market sentiment and potential trend reversals.
Technical Analysis Offers Crucial Insights for Traders
The TD Sequential indicator, developed by Tom DeMark, counts a sequence of price bars to identify potential turning points in the market. A buy signal at count one suggests a possible price bottom, inviting buyers to enter.
Ali Charts’ observation of the buy signal on the 4-hour chart adds a time-sensitive aspect to the trading strategy. Short-term traders often rely on such signals for timely entries and exits. This makes the $2,550 support a focal point in decision-making.
Market participants are now weighing whether Ethereum will hold above $2,550 and begin a rebound or break below this level. The answer could define the price trajectory in the upcoming sessions. The presence of technical indicators and support levels provides a structured framework for trading decisions.
Could holding above $2,550 be the catalyst for Ethereum's next upward movement? This question remains central to market watchers and analysts alike, as the digital asset continues to navigate a volatile trading environment.

