Hello Binance Square family! 👋
Let's delve into the latest weekly analysis of THETA/USDT and explore potential trading opportunities.
---
🔍 Technical Overview
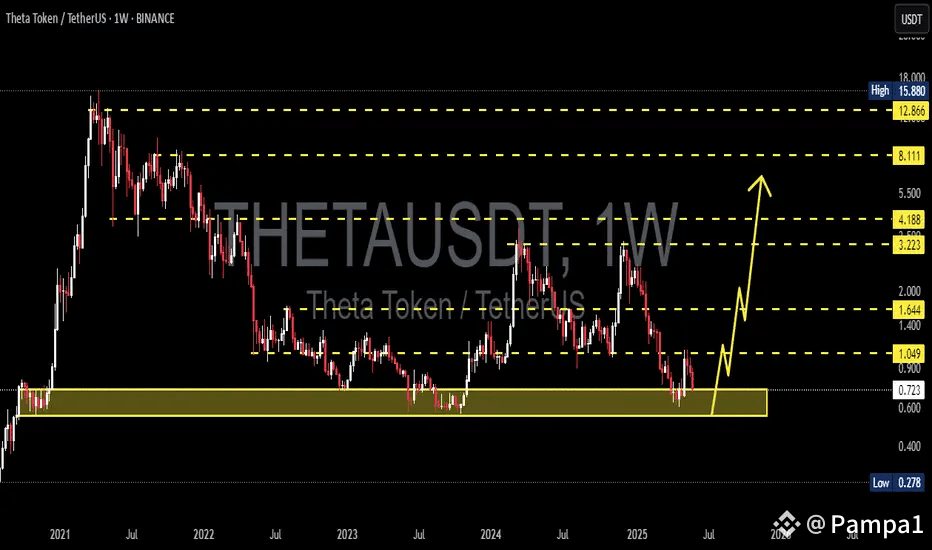
Recent observations on the THETA/USDT weekly chart suggest a potential bullish scenario:
Support Zone: The price has approached a significant support area, which has previously acted as a springboard for upward movements.
Oversold Conditions: The Relative Strength Index (RSI) indicates that THETA is in oversold territory, suggesting a potential reversal.
Volume Analysis: An increase in trading volume supports the recent price movements, indicating growing investor interest.
---
🎯 Potential Trade Setup
Based on the current technical indicators:
Entry Point: Traders might consider entering around the current support zone, anticipating a bounce.
Target: A short-term target of at least 20%+ gain from the entry point is plausible, given the bullish patterns observed.
Stop Loss: Implementing a stop loss below the support zone can help manage risk in case the market moves against the position.
---
⚠️ Risk Management
As always, it's crucial to:
Conduct Thorough Research: Ensure you're informed about the asset and market conditions before entering a trade.
Use Proper Position Sizing: Only risk a small percentage of your trading capital on a single trade to manage potential losses.
Stay Updated: Monitor the trade and adjust your strategy as the market evolves.
---
📌 Final Thoughts
The THETA/USDT pair is showing promising signs of a potential upward move, supported by technical patterns and indicators. However, always remember that trading involves risks, and it's essential to approach each trade with a well-thought-out plan and risk management strategy.
Happy trading, and may the markets be in your favor! 🚀📊
*Disclaimer: This article is for informational purposes only and does not constitute financial advice. Always conduct your own research before making trading decisions.*