This is not financial advice, just a technical perspective. $TRUMP
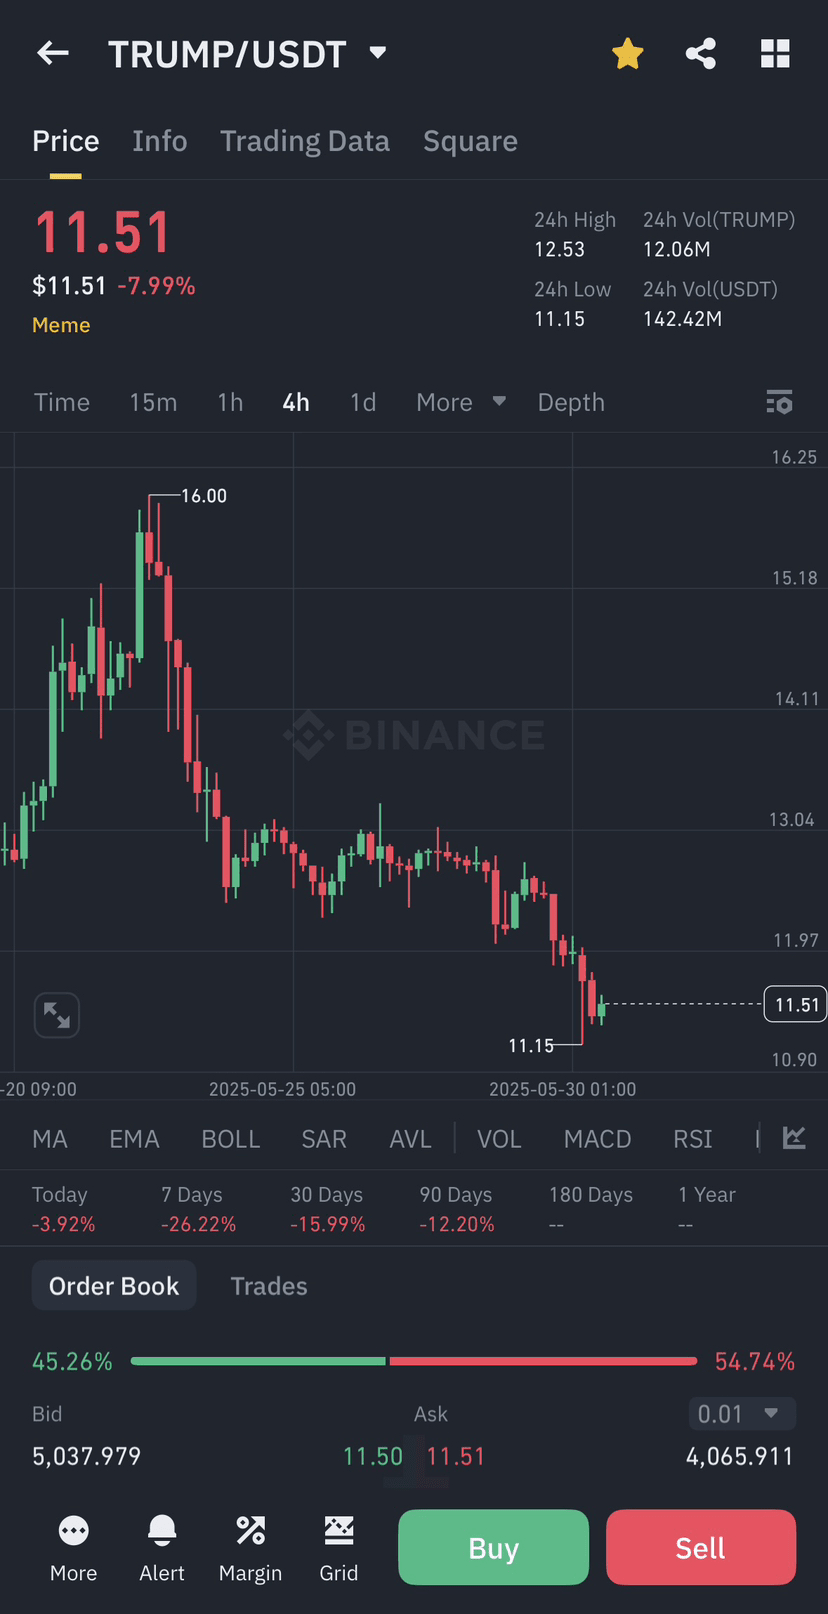
🔍 Technical Overview (4H Chart)
Current Price: $11.51
24H Low / High: $11.15 / $12.53
Trend: Downward trend over the last several days, with a recent bounce off the $11.15 support level.
Volume: 24H volume is relatively high (12.06M TRUMP), indicating active trading.
📉 Bearish Indicators
Price has dropped from a recent high of $16.00 to $11.51.
Overall, there’s a consistent series of lower highs and lower lows, which suggests continued bearish momentum.
The asset is down ~26% over 7 days and ~16% over 30 days, which is steep and indicative of selling pressure.
📈 Bullish Hints
Price bounced off $11.15, forming a potential short-term support.
Small green candle after hitting the local low could indicate some buying interest or relief rally.
If $11.15 holds, we could see a bounce back toward the $11.80–$12.20 range in the short term.
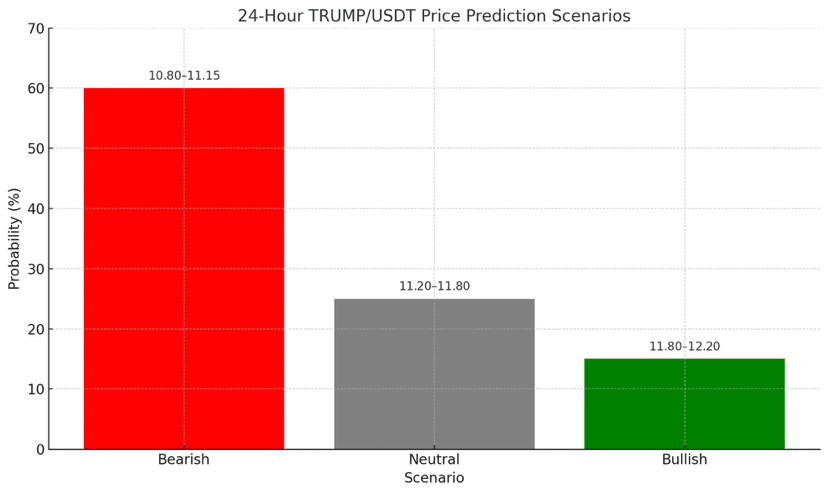
📅 Next 24 Hours: Price Prediction
Scenario Likely Range Probability
Bearish $10.80 – $11.15 60%
Neutral/Sideways $11.20 – $11.80 25%
Bullish Rebound $11.80 – $12.20 15%
📌 Key Levels to Watch
Support: $11.15 → If broken, next support could be around $10.80–$10.50
Resistance: $11.80–$12.20 → Needs to break and hold above to shift trend.
#CEXvsDEX101 #MarketPullback #TradingTypes101 #TrumpTariffs #TrumpMediaBitcoinTreasury