I am 33 this year. In 2017, I entered the crypto market with 50,000 yuan, and since then, I started my journey in the crypto market!
I started as a small investor with 50,000 yuan and have finally become a middle-class individual with 800,000!
I will share my insights from my journey. The most important point in trading is fund management; don't invest all your money at once. I prefer to divide my funds into five parts and only use one part for each operation, so even if I incur losses, I won't be too heavily pressured. Moreover, I set a rule for myself: if I lose 10%, I will withdraw immediately, regardless of how the market is behaving. If I lose 10% consecutively five times, I would only lose 50%, but if I make a profit, the returns could be more than that. Even if I get stuck in a position, I can still maintain my mindset.
Following the market trend is always the most reliable strategy. When the market is falling, don't think about bottom fishing; that's simply unrealistic. When prices are rising, a pullback is the golden opportunity; buying low is much safer than stubbornly trying to catch the bottom.
Choosing cryptocurrencies requires sharp insight. Avoid coins that experience rapid surges, whether mainstream or altcoins; coins that rise too quickly will also experience substantial pullbacks, making it easy to get stuck.
In terms of technical indicators, I use MACD the most. When the DIF line crosses and breaks the zero axis below, it is a buy signal. Conversely, if they cross and move down above the zero axis, then you should reduce your position.
When it comes to averaging down, don't try it lightly! If you're at a loss, don't average down; the more you average down, the more you lose, and in the end, you might have nothing at all. Remember, cut losses when you're losing, and only add to your position when you're in profit.
Trading volume is also very critical. When the price breaks through at a low level, if the trading volume increases, it is usually a significant opportunity.
The most crucial point is to follow the trend and seize the momentum! Combine daily, 30-day, 84-day, and 120-day lines; when any line begins to turn upwards, you will know how to operate.
The path of trading cryptocurrencies carries risks but also significant opportunities.
Learning fund management, trend analysis, and cryptocurrency selection is essential to evolve from a small investor to a middle-class individual like me.

Master the naked candlestick secrets to perceive the market's pulse in five minutes and precisely capture trading opportunities!
Candlestick charts, which originate from the wisdom of the rice market trading during the Tokugawa shogunate in 18th century Japan, also known as candlestick charts or Japanese lines, have evolved over more than three hundred years and have become indispensable analytical tools in the TD, futures, forex, options, and even virtual currency markets.
Candlestick charts are not only a historical scroll of price fluctuations but also a profound reflection of Eastern philosophical thought. The transformation of yin and yang symbolizes the ebb and flow of bullish and bearish forces, showcasing the subtle shifts of market "momentum."
Each candlestick is a microcosm of the market's daily fluctuations. By connecting daily candlesticks sequentially, a historical trajectory of price fluctuations is outlined; this is the candlestick chart.
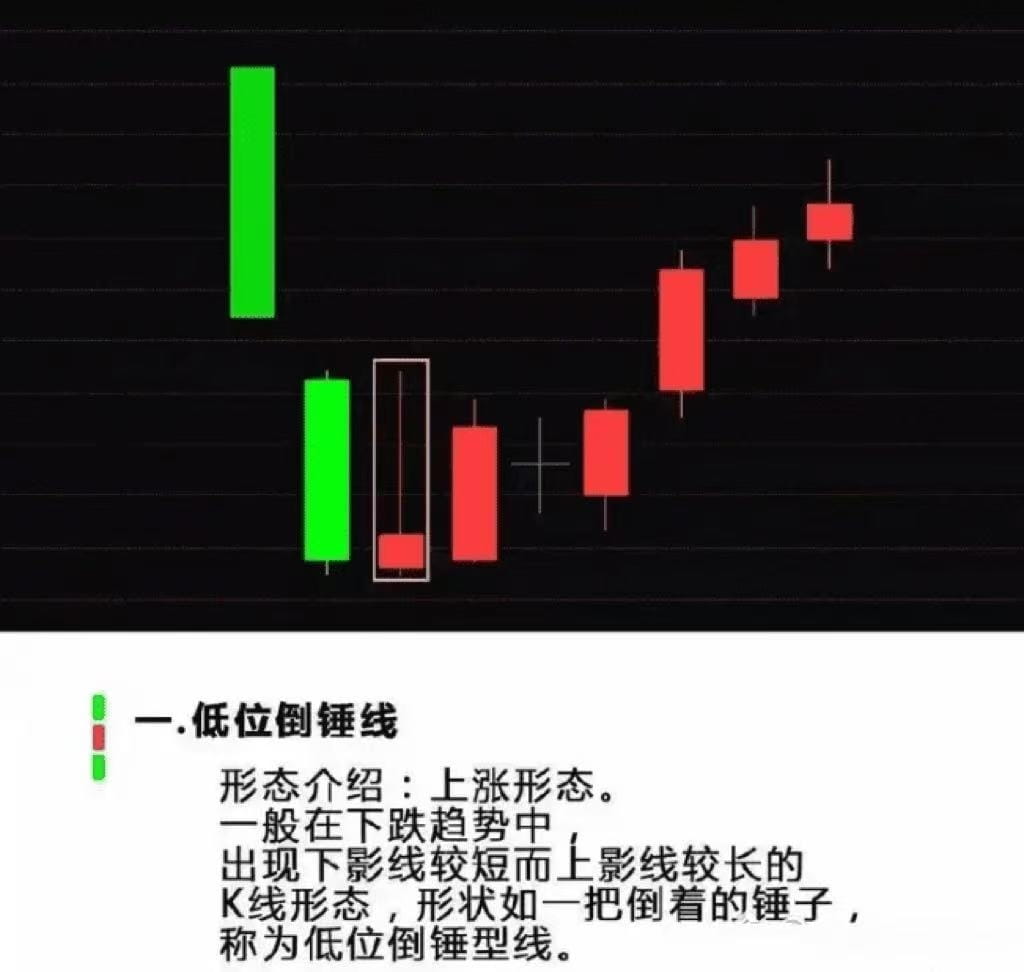
The components of a candlestick include the opening price, closing price, highest price, and lowest price, four key elements. If the opening price is lower than the closing price, it forms a bullish candle; conversely, it forms a bearish candle. The rectangle in the middle, combined with the upper and lower shadows, constitutes the unique shape of the candlestick. Daily, weekly, monthly, and even minute and hourly candlesticks represent the candlestick chart in different time dimensions.
Draw candlestick charts with time on the horizontal axis and price on the vertical axis, continuously depicting daily candlesticks, vividly illustrating the market's fluctuations. The candlestick bodies, alternating red and green, symbolize price movements. Red bodies symbolize price increases, closing higher than the opening price; green bodies represent price declines, closing lower than the opening price.
If the opening price equals the closing price, it forms a doji, indicating a subtle balance in the market. So, what does the candlestick chart look like? And how should it be interpreted? Please savor the following image and let the secrets of the market slowly unfold before your eyes!


What does naked candlestick trading analyze?
Naked candlestick analysis mainly consists of four modules: trend, position, momentum, and signal.

These four core analysis sections are not isolated; they support and promote each other, working together.
When facing the fluctuations of the market, if we can conduct an in-depth analysis from these four dimensions, it will make our analysis more comprehensive and systematic, avoiding impulsive behaviors just because we captured a trading signal. This is a common misunderstanding among many novice traders.
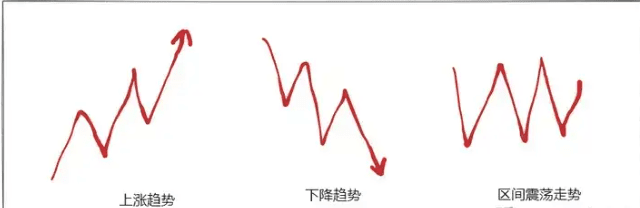
So, how can we accurately grasp the pulse of the trend? When it comes to trend analysis, three key elements must be remembered: structure layout, operational direction, and volatility level. As for identifying naked candlestick trends, it mainly relies on classic technical theories to define trends.
From a structural perspective, when observing clear peaks and troughs continuously rising, it can be determined as an upward trend; conversely, if peaks and troughs are continuously declining, it is regarded as a downward trend; and fluctuations between peaks and troughs are classified as a consolidation pattern.
In trend judgment, the biggest difficulty lies in the division of levels and the transition of trends.
The division of trends at different levels involves issues of primary and secondary rhythms. Beginners are easily swayed by small-level trends, often overlooking the main trend, leading to confusion in trading direction. Is the trend transition a correction or a reversal? It's not easy to judge because there are no absolutely quantifiable standards.
To address the issues of different levels and trend transitions, my approach is to define your main trend and critical points. Since the starting point for selecting a trend is different, the trend direction perceived by you may not be the same as that of others.
So you need to define the trend you have divided, find its main trend, and then identify the critical points of each trend level. Critical points are generally horizontal lines and trend lines. Is the price position high or low?
Keywords for position: support levels, resistance levels, risk-reward ratio. Why do you chase highs? Why do you always make small profits and large losses? This is related to the judgment of price positions. If you always trade long at resistance levels and short at support levels, not only is the failure rate high, but the risk-reward ratio is also very low.
Position judgment is also very important; is the price high or low? Personal basic measurement standards: support levels belong to low prices, resistance levels belong to high prices, as take-profit settings are also set at support and resistance levels.
Therefore: Buy at support levels, sell at resistance levels, the long position has the maximum risk-reward ratio, buy at resistance levels, sell at support levels, the short position has the maximum risk-reward ratio.
Unless you are trading a breakout, all long positions at resistance levels are considered high-entry trades, and all short positions at support levels are considered chasing down trades.

This is based on support and resistance levels to determine the highs and lows of prices.
If you add the concept of trends, how would you judge the high and low positions? How to judge the transition of momentum strength?
Keywords for momentum: trend movement, candlestick patterns, slope. Momentum can be said to be the cornerstone of trend movement; without momentum, there is no existence of a trend, so momentum analysis is also a very important module.
What is strong momentum, and what is weak momentum? Strong momentum: Trend movements, consecutive bullish or bearish, large bullish or bearish candles, steep slope. Weak momentum: Range movements, doji, small bullish or bearish candles, gentle slope.

An upward trend must have bullish momentum stronger than bearish momentum. A downward trend must have bearish momentum stronger than bullish momentum. Range fluctuations indicate that bears and bulls are in a stalemate, and narrow fluctuations indicate a trend of energy accumulation.
From strong to weak trends, trends are a form of momentum. The trend from large bullish candles to small bullish candles indicates a weakening of bullish momentum. A change from large to small slopes indicates that momentum is weakening, and vice versa. The above is based on trends and price candlestick forms to judge changes in price momentum, thus determining the market's price movement direction.
So, if you add position and momentum strength analysis, what is the special change? Is it reliable to look solely at signals for entry? Keywords: trend, position, momentum. When it comes to signals, many of us only think of hammer lines, engulfing lines, and other starting signals.
When it comes to trading signals, they must be based on the three modules of trend, position, and momentum. If you analyze signals without considering the first three modules and directly enter trades, you will find that the success rate is low; this is why trading signals cannot be detached from market conditions.
Personally, sometimes I don’t always wait for trading signals to enter because I have a good grasp of price trends, positions, and momentum.
In the end, this article elaborates on the four analysis modules of naked candlestick charts, each module covers many knowledge points, which requires you to have a solid foundation. However, the four modules form a large analysis framework. If we haven't found the direction for analysis and trading, we might as well start by sorting the market through these four modules.
In addition, there are several key technical levels worth noting: 1)
Psychological support and resistance points are usually at integer exchange rates, such as 1.00, 1.10, 1.20, etc. Many traders tend to place orders near these integers.
2) Fibonacci retracement levels - Finding potential levels and trends for price pullbacks. When used on higher time frames, important Fibonacci levels (like the 61.8% retracement level) can become key technical levels where there may be a large number of open orders.
3) Pivot points - Pivot points are points where market direction changes within a day. By simply calculating the previous day's highs/lows and closing prices, a series of points can be obtained to form key support and resistance lines. Range traders can use the pivot point system to confirm potential reversal points, while breakout traders can use the pivot point system to confirm key breakout points of trends.
4) Dynamic support and resistance points - Key technical levels are not necessarily fixed; they can also be dynamic. Moving averages are usually used to determine dynamic key technical levels near EMA appearing within 50 days, 100 days EMA, or Fibonacci EMA levels (like 144 days EMA).
5) Integration areas of support/resistance - These areas are cross-sections of different important technical levels. For example, an upward trend line may provide price support at a horizontal support level. This will form an integrated support area of the upward trend line and horizontal support. As always, learn from the market.
The market is changing; trading isn't just about having an epiphany. It requires consistent stable profits over weeks, months, or even years to truly demonstrate that you are moving in the right direction and that it has been proven feasible through practice. Don't pay too much attention to others' opinions since the vast majority are losers. The market is the best teacher; focus on yourself, remain consistent, overcome impulse trading, and approach the market with caution and respect.
Trading wisdom in the crypto market:
Master the following secrets to help you navigate the crypto market and secure substantial profits!
Unveiling the essence of trading cryptocurrencies: Once a critical price level is broken, short-term opportunities vanish in an instant. Interpretation: When the price breaks through significant support or resistance levels, it signifies the arrival of short-term trading opportunities, and swift action is essential to avoid missing out.
After a surge, a pullback usually follows; do not chase high prices out of greed. Interpretation: After a price spike, a pullback often follows, so do not impulsively chase the rise; stay calm and maintain your mindset.
Beware of the main force setting traps to lure the crowd. Interpretation: If prices rise without an increase in trading volume, this may be a false price increase created by the main force, luring retail investors to enter; stay alert and avoid being deceived.
Don't panic when there's a sharp drop with shrinking volume; retreat when there's a slow drop with increasing volume. Interpretation: If the price drops sharply while trading volume is low, there's no need to be overly anxious; however, if the price drops slowly and trading volume increases, you should decisively exit to avoid losses. The main upward wave accelerating indicates the top is near. Interpretation: When the price rises rapidly, it often signals that a top is imminent, so you need to closely monitor top characteristics and prepare to respond.
Do not chase highs when entering the market; a pullback is a good opportunity. Interpretation: When purchasing cryptocurrencies, do not chase in when prices are high; the risk is significant. The best time is to buy during a price pullback when it is relatively reasonable.
Combining daily and weekly charts is key to gaining insight into the main force's direction. Interpretation: When analyzing price trends, it is necessary to combine daily charts with weekly charts and even longer time period charts to accurately grasp the main force's intentions and market trends.
Combining daily and weekly charts is key to gaining insight into the main force's direction. Interpretation: When analyzing price trends, it is essential to combine daily charts with weekly charts and even longer time period charts to accurately grasp the main force's intentions and market trends.
Minor fluctuations need not worry, but continuous significant rises require vigilance. Interpretation: Small price fluctuations are normal and do not require excessive worry; however, if prices rise significantly for an extended period, one should be cautious to prevent risks associated with an overheated market.
A new low in price with reduced volume may indicate a bottom signal; when trading volume recovers and prices begin to rise, the timing to enter the market is ripe. Interpretation: When the price drops to a new low and trading volume shrinks, it may indicate that a bottom has emerged; when trading volume recovers and prices start to rise, it is the best time to enter the market.
Keep going, I am Little Seven, sincerely wishing you to get rich in the crypto market.
Continuously pay attention to $BTC $ETH $BNB
Bulls have their strategies, and bears have their plays.
Little Seven will not lead fans to liquidation, nor will they blindly open positions.
It's all about seeking victory steadily, making steady progress. If you want to eat meat, keep up with Little Seven's moves!


