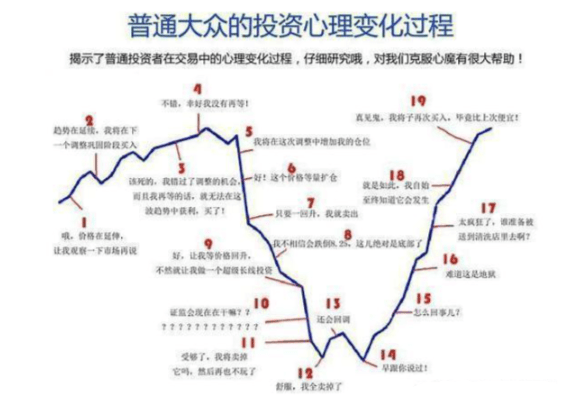
The classic retail investor's stock trading mentality
What would you lose if you didn’t watch stocks? What would you gain if you did? You would certainly say that if I had held that stock back then, I would have made some profit. As a retail investor, you are not the market maker's match in analysis, research, information, or funds, but even if the market maker wears an iron shirt, they still have unknown vulnerabilities. What do market makers fear the most? The answer I give you may sound ridiculous—market makers fear that you will not watch them! Because they know your greed and fear, and the market maker's schemes are conveyed to you through operators. They make the trading market full of surprises; they make the candlestick chart appear deceptive and dramatic. As long as you open your eyes and look, you will feel anxious and lost, and you will be in constant worry. The market maker conquers you this way, as they treat this trading market as a theater, seeing themselves as the star performer, while you willingly become a loyal audience, allowing them to perform freely. When you do not watch them, when they have no audience, when they play to the void, they are truly afraid because their money is borrowed, and they have to pay the operator's salary. When faced with someone who doesn't watch or inquire or rush, when faced with someone who is ignorant, desireless, fearless, their performance becomes futile. This is the vulnerability of the market maker, and this kind of stock is the retail investor that the market maker can never defeat.
Impatient investors' mindset resonates with most retail investors:

1. Always fully invested, ensuring that the margin balance is enough to buy one fund without missing out.
2. When the market rebounds, always calculate profits and losses based on your own cost, never calculating that many people have made profits from the bottom of the stocks that have been trapped below their buying price, and will never sell until the stock price rises above their buying price. Yet when the stock price falls, they regret not selling at that time, but when the next rebound occurs, they still make the same mistake.
3. Not knowing that there are take-profit and stop-loss positions when buying stocks, and once the stock price falls below the buying price, they will never sell until the next bull market frees them.
4. Not knowing that buying stocks can also lead to losses, they may have heard the stock market saying that one earns two, breaks even seven, but always see themselves as among the clever and profit-making crowd, thinking others are more foolish than themselves.
5. When buying stocks, they may not even know what the company does, just listening to others talk, listening to stock reviews, and possibly charging in without even thinking.
6. Severe gambler mentality, after a loss, one desires to not only recover the loss but also make a big profit next time, yet does not understand why they lost last time, failing to learn properly and thus repeatedly stumbling in the same place without summarizing lessons, always believing they are right.
7. Daring to invest their hard-earned money in the stock market without even understanding the most basic knowledge of the stock market.
8. Cowardly yet greedy, never knowing when to stop, not understanding that stock prices are just paper wealth; selling to cash in is the real deal.
9. Always judging market news, trends, and individual stocks based on their own standards, and when wrong, they do not correct, leading to serious traps.
10. Failing to see the market's treachery, always using a good heart to judge good news, management, funds, institutions, brokers, and even all market participants, and in the end, the one who gets hurt is always oneself.
11. Not humble in learning, a half-filled bottle shakes, in Cantonese it is said 'knowing how much plays a representative,' thinking you know everything while knowing nothing, next time you will still be trapped.
12. When making a small profit, they shout it everywhere, wanting the whole world to know, but when they lose money, they do not dare to admit it.
Patience is more important than anything else; this is explained too thoroughly
Trading is a process that requires continuous learning and accumulation. A seasoned trader with 20 years of experience is definitely different from a novice trader with 2 months of experience. However, this does not mean that the longer a trader's experience, the higher their level. The root cause is that many traders trade stocks with the wrong mindset, even though they have years of trading experience. They do not know how to observe, think, and summarize, and merely make trading decisions based on their feelings. However, this is not true stock speculation; it is a form of disguised gambling!
The core of stock trading is probabilistic thinking. In short, it means actively participating in high-probability events while working to prevent low-probability events. Whenever a trader opens a position, they believe that the direction they are taking is a high-probability event for the market's development. Traders lacking probabilistic thinking typically exhibit two behaviors: being over-leveraged and having no stop-loss, as they do not consider low-probability events. Therefore, no matter how much money a trader has made in the stock market in the past, as long as they lack this probabilistic thinking, the market can crush them in a black swan event, making it impossible for them to recover.
If we know that we must always maintain probabilistic thinking in trading, the next question is how to discover high-probability events and how to prevent low-probability events. In searching for some high-probability events, some traders use technical analysis, some use fundamental analysis, and some use a combination of fundamental and technical resonance methods. For a long time, these two factions have often been incompatible and attacked each other. In fact, no method is inherently good or bad; the judgment results of either side are not 100% accurate, but just a probability. When it comes to preventing low-probability events, most traders have the same idea: that is, managing their funds. However, more importantly, it is self-management, because most subjective traders have poor consistency.
Participating in high-probability events is actually divided into two processes. First, we need to identify what a high-probability event is, and second, when to participate in high-probability events. Essentially, the former tests the trader's ability to choose varieties, while the latter tests the trader's ability to choose timing. It is well-known that stock varieties have the characteristic of rising and falling simultaneously. In this case, why do we sometimes choose to produce more iron ore instead of rebar when prices are rising? This is because, based on fundamental analysis, we believe that iron ore has more room for appreciation than rebar. Since we judge that individual stocks will rise later based on fundamental analysis, why don’t we choose to enter? This is because the role of fundamental analysis lies in the selection of varieties, while the timing for entry needs a clear signal from technical analysis.
Many traders confuse the roles of fundamental analysis and technical analysis, leading to chaotic operations. In fact, the main function of fundamental analysis is to select varieties and judge directions, while the main function of technical analysis is to select timing for entry and exit. Many technical analysts do not agree with fundamental analysts. Some believe that fundamental analysis is only considered after the fact, while others think that retail investors cannot understand fundamentals. In fact, fundamental analysis uses deductive methods to judge market trends, while technical analysis uses inductive methods to judge market trends. The former is based on strict logical reasoning, while the latter is based on the assumption that history will repeat itself. However, trading is not a science, so fundamental analysis is not always effective. At the same time, history does not simply repeat itself, so technical analysis is also not always effective. Therefore, the judgment results of both analysis methods are only probabilities.
Smart traders always hold probabilistic thinking. They identify high-probability events through fundamental analysis and use the clear signals provided by technical analysis to participate in high-probability events. At the same time, to prevent black swan events, they know how to manage their capital effectively. To show their respect for probabilistic thinking, when they identify what they believe to be a high-probability event, they do not rush to enter, but patiently wait for strong entry signals from technical analysis.
How much do you know about chip distribution?

First, you need to know it
What is it really~
Part1 A story about chips
A company has 1000 shares of stock
Held by three different investors

Shareholder A bought 100 shares at the price of 5.1 yuan
Bought 300 shares at the price of 5.2 yuan

Shareholder B bought 100 shares at a holding cost of 5.3 yuan
Also bought 200 shares at 5.4 yuan

Shareholder C bought 200 shares at 5.5 yuan
Holding 100 shares at 5.6 yuan
Adding up to exactly 1000 shares

Let us review the growth journey of the three shareholders

This chart looks like
Doesn't it look a bit like the chip distribution chart?

So why are there red and green on the distribution chart?
Next, if one day the stock price is like this

At the close of the day
Both shareholders A and B are in a profitable state
C is in a losing position
Assuming that A takes profits the next day
Sold the chips in hand in batches to D
Then the chip distribution has a significant difference from the previous day

Because Shareholder A with the lowest holding cost has left with a profit
Leaving most investors in a trapped state in confusion
Then the movement of the chips is reflected in the chip distribution chart
But in fact, chip distribution does not care about who the chips belong to
The price distribution of real listed companies is quite broad

Each price range has a horizontal line representing the holding volume
The larger the holding volume, the longer the line
These lines of varying lengths are stacked together
Formed the shape of chip distribution
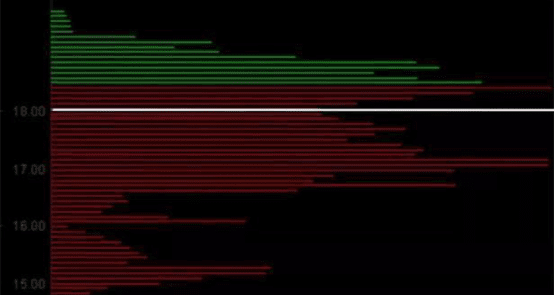
The green line indicates that the chips are in a losing state at the current stock price
The red line shows that the current stock price is in a profitable state
The white line represents the average cost of all holdings in the market
(Different software has different colors)

Now you should understand the principles of chip distribution~
Part2 About the shape of chips

First, we must determine the shape of the chips
The simplest is the single peak dense shape
That is to say, the chips of individual stocks have only one chip peak

There is almost no chip distribution above and below this dense peak
Indicates that the circulating chips of this stock are
Sufficiently concentrated around a specific price

Single peak density can be divided into low-level single peak density and high-level single peak density


For example, in the following stock
Chips are all highly concentrated at the bottom
Recently, the stock price performance is also almost in a horizontal state

Long-term horizontal consolidation is an important method for the main force to accumulate positions
This is also a major reason for the formation of single peak density

The horizontal trading area can be seen as the target price area for the main force's accumulation
The main force uses a long period of horizontal trading in this area
Will force impatient followers and short-term traders out
And use up and down fluctuations to accumulate chips and wash the plate
The higher the density of the single peak, the longer the formation time
This means that the turnover of chips and the main force's accumulation are more sufficient
The subsequent upward trend's strength is greater

Conversely...

But low-level chip concentration does not necessarily mean an upward trend
It may also drop due to negative news
It just means that once it breaks out, there is a possibility of a rapid increase
In actual operations, attention should be paid to:
The stock price must break through the low-level single peak dense price with the cooperation of trading volume
Be cautious of false breakouts when there is no volume

The pullback after the stock price breakout is prone to
The upper edge of the original low-level single peak has received support
Once it is confirmed that the stock price cannot fall, positions can be built appropriately

Pay attention when the stock price pulls back and breaks below the low-level single peak
If it is accompanied by a volume drop breaking down, directly reduce positions or go into cash
Here it is worth noting that
Low level is not based on absolute stock price
Mainly refers to the new concentration formed after a significant decline from the last concentration
Can be judged based on previous historical highs and lows
Whether it is a low-level chip
Compared to the low-level chip peak
The time for the formation of the high-level chip peak is relatively short
The density is relatively low

It may either be a high-level consolidation waiting for another rise
It may also be a sign of the market maker unloading
Requires very careful distinctions
If the stock price falls below the high-level single peak dense area
Without saying a word, reduce positions

Because it forms a high-level single peak density turnover process
In essence, this is the process of the market maker distributing chips to retail investors

Especially when the stock price has risen too much and is consolidating at the peak
When forming a high-level chip peak, especially be cautious
Because once it falls below this chip peak
Indicates that the previous main force has already run away
Continuing to stay inside is extremely dangerous

If the stock price breaks above this high-level chip peak
Should operate with a short-term strategy, beware of false upward movements
Breakthrough must have volume; no volume is mostly a trap to attract buyers
The longer the time for the formation of a high-level dense peak, the higher the density of the peak
It is almost certain that this is the result of the market maker washing the plate and accumulating chips

Because market makers usually do not take that long to shake out
And retail investors' patience and confidence are also limited

The previous high-level single peak density often becomes the resistance level for the next wave of trends

The corresponding to the single peak is the double peak density and multi-peak density
Double peak density means that individual stocks have two dense peaks of chips
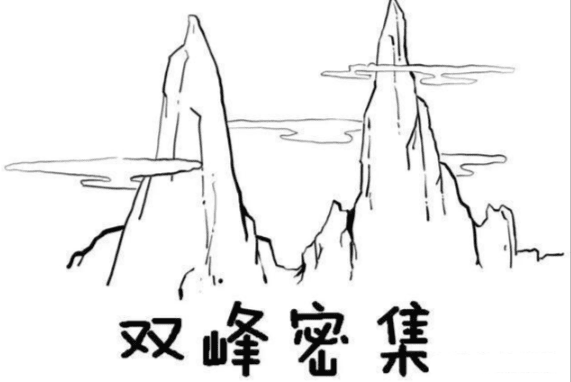
This shape has strong support and resistance for stock price movements
When the stock price reaches the upper chip peak, it is prone to encounter selling pressure from trapped positions
Faced with resistance and falling back
When the stock price reaches the lower chip peak, it is often absorbed and rebounds
Therefore, the upper chip peak is called the resistance peak
The lower dense peak is called the support peak

Multi-peak density means that the chips of a stock have many peaks

In simple terms
In the process of rising, each peak above is a resistance zone
And in the decline process, each peak is a support

Part3 What exactly do you understand?
So what do these shapes mean?
1. Chips that do not sell when in profit are the chips of the main force
Generally, it is difficult to see the main force unloading when profits are below 30%


2. Chips that do not sell when released are the chips of the main force


3. Chips that cannot be washed away in sideways trading are the main force's chips
4. The upper peak does not move, and the decline does not stop
In the process of the stock price falling, if the high-level dense peak does not move down

This indicates that the high-level trapped positions still exist, and in the future, the market will be pressured by the trapped positions.

It is difficult for the stock price to rise. For such individual stocks
Do not easily participate in medium or long-term wave operations
5. Lower peak locked in; the market has not stopped
During the stock price rise
If the low-level dense peak has not shown any loosening
Indicates that the market's holdings are stable, and the selling pressure in the market is not large


(Still the previous example)
This situation often occurs in individual stocks with major funds involved
This indicates that the main funds have not exhibited a distribution of chips
Therefore, the market has not ended, and the stock price will continue to rise
For such individual stocks, you can continue to hold shares or participate in wave operations.
Chip concentration stock selection method
The generally understood chip concentration refers to the degree of a specific stock's chips being concentrated, that is, the extent to which a stock's effective circulating chips are controlled by the market maker. The higher the chip concentration, the stronger the market maker's control over the market.
To be honest, we have no way of knowing the extent to which a stock's chips are controlled by the market maker; this is the market maker's trump card. If the trump card can be seen by others, the market maker cannot play anymore, so they will do everything possible to hide this real information.
Although investors cannot see the true control of chips by the market maker over a stock, we can draw rough conclusions through overall analysis of some data or indicators.
Common indicators of chip distribution in the market can help us make rough judgments in this regard. Today we will introduce the chip distribution concentration stock selection method based on this indicator. Chip distribution is a very peculiar indicator and also a very complex indicator, but it is certainly not as magical as many people claim. All conclusions drawn from this indicator only have relative significance. Chip distribution concentration is a small indicator used in conjunction with the chip distribution indicator.

The chip distribution indicator is divided into upper and lower parts. The upper part is the chip distribution chart, while the lower part, as shown above, displays some key data. In different trading software, this column of data may vary, but is generally similar. The chip distribution concentration is usually listed.
Chip distribution concentration is also known as cost concentration; it reflects the size of the price range occupied by a certain proportion of chips. As shown above, 90% of the chips of this stock (Kelun Electronics) are currently in the price range of 8.54-9.40, with the concentration value displayed above being 4.8, which is a very small value, yet it indicates that the current chip distribution concentration of this stock is very high.

For 90% of chips, if the concentration value is below 10, it indicates that the concentration of chips has become very high. The more concentrated the chips, the more fully the stock has adjusted. Based on this, it can be inferred that the market maker's control over the chips may be very high, thus the likelihood of the stock rising is very large.
From the shape, how can we determine if chips are concentrated?

For example, if the chips of this stock are mostly concentrated between 15.00 and 18.00 yuan, then the fluctuation range is 3 yuan, which is about a 20% range. This fluctuation range is considered chip concentration. If the circulating volume is small and the range is volatile, it is generally considered a washout and accumulation. If it is an accumulation action, another rise is likely to initiate the trend.
Reasons for chip concentration:
Chip concentration can have two possibilities: one is that the main force is accumulating chips for a rise, and the other is a state without a market maker.
The process of chip concentration:

Chip dispersion: After a wave of declines, chips will be dispersed to various price levels.

Selling pressure from trapped positions above: the trapped positions above and new funds reaching a handover results in chip exchange, which is the stage of the main force's accumulation.

Bullish moving averages, volume breakout creates a buying point: This bottom structure forms a box breakout that creates a buying point.
Chip performance: Concentrating all profits.
Summary: Chip concentration generally occurs after a long horizontal trading period, and the purpose of horizontal trading is to achieve the goal of absorbing chips through the turnover of high-level trapped positions and new funds.
Determine whether the bottom chip concentrated stocks have a market maker
Characteristics of market makers:
There is a clear top and bottom structure, which is a sign of capital control. Chip concentration usually leads to a box structure.

Bottom no market maker characteristics:

Generally, those who can emerge from the bottom structure usually have market makers; it’s just a matter of strength, and here is an example of a stock without a market maker for observation.
Such declines have no lower limit, and those with small declines generally lack market makers; rapid declines have market makers, while gradual declines do not.
He who knows himself is wise—valued are those who are self-aware
He who knows others is wise; he who knows himself is enlightened. He who conquers others is strong; he who conquers himself is mighty. He who is satisfied is rich; he who acts forcefully has ambition; he who does not lose his position lasts long; he who does not die lives long.
Investors who can understand and recognize the intentions and mindset of others are wise, while those who can recognize their own character flaws are truly enlightened.
Investors who can conquer others have strength; investors who can conquer their own weaknesses are the true strong ones.
Knowing when to stop and being satisfied is wealth. Being able to work hard and persist indicates a strong will.
Investors who can position themselves correctly in the stock market will have long-term stability.
Even if temporarily trapped, they will not be trapped to death, allowing investors to survive for a long time in the stock market.
Everyone has inherent weaknesses, especially in the constantly changing stock market where interests are at stake, these weaknesses become more evident and worsen, becoming unfavorable factors that affect their performance in the market. Therefore, in the stock market, mere intelligence is not enough; one must also have the willpower to overcome their weaknesses to become a true strong player in the market.
The category of self-weakness in psychology is very broad, but in the stock market, the main psychological factor affecting investors' investment mindset is self-destructive psychology, the most typical of which is gambling mentality.
Gambling is fundamentally a game of luck. Psychologists refer to the gambling mentality as 'addiction without medicine.' Different social environments have different forms of gambling, and everyone may experience gambling at least once in their life. Psychologically, gambling mentality is divided into three categories: one is the ordinary psychology of occasional gambling to regulate life's interest and rhythm; the second is the professional gambling psychology of gambling for a living; the third is the innate gambler's psychology that is governed by the subconscious and cannot be restrained.
The innate gambler's mentality is the most harmful in the stock market; they always believe that 'this time' they will be lucky, wanting to try their luck at any time. After winning, they feel invincible, experiencing an endless sense of satisfaction. Those with this psychological weakness are usually losers in the stock market. Because they cannot position themselves correctly in the stock market, they always seek that gambling feeling instead of participating in trades with an investment mindset through rational analysis. They may sometimes lose money without caring, and sometimes even act as if they are winners, while internally they are in immense pain. This is because they cannot introspect, cannot face the fact that their failures stem from their psychological weaknesses. They believe that the gambling feeling they get in the stock market is more noble and stimulating than at the mahjong table. They are either arrogant or dejected but cannot remain calm and rational. Because they are not interested in the buying and selling process; they only seek that 'excitement' feeling.
The psychology of gambling addiction has many similarities with that of alcohol addiction. For example, those with a gambling mentality and those with alcohol addiction both lack the ability for self-reflection and self-control. What they want is excitement rather than profit from stock trading.
Having this mentality in stock trading is very harmful because they have not positioned themselves correctly in the stock market, gambling with a small amount of money against the large market maker, how could they not lose? Those with this mentality should best refrain from participating in stock trading.
Every investor actually harbors this kind of psychological weakness, so regardless of the type of investor, when participating in the stock market, they must strive to overcome it, relying on a strong will to conquer this unhealthy psychological weakness in themselves in order to position themselves correctly and survive for a long time in the stock market. How to know if you are participating in the stock market with a gambling mentality? The most important thing is introspection; through self-reflection, recognize whether your mindset is normal.
An important indicator of a gambling mentality is that investors cannot control their desire to place orders, unable to control their emotions in front of the keyboard, leading to erroneous orders. If investors realize this through reflection, they should decisively pause trading, or even take a short break of several days to calm down and reflect on their mindset: whether they can self-control and analyze rationally whether their operations are governed by rationality or by gambling mentality. After understanding themselves, they should use this as a reference for the next stage of operations to avoid repeating mistakes.
Be brave to admit failure. The gambling mentality can make people uncontrollable in the face of failure, continuously placing orders and failing repeatedly. Therefore, investors must restrain their impulses after a failure.
In addition, it is necessary to distinguish between investment risk and gambling. In some cases, investors may still fail despite rational operations, which is a unique risk of the stock market, and cannot be blamed on rational psychology. Therefore, in such cases, investors should still think rationally and come up with good strategies to rescue themselves after a failure. Whether to stop losses or hold positions stubbornly should still be guided by rationality, and should not be influenced by failures to develop a gambling mentality, and should not act recklessly; otherwise, investors will slide further down the path of failure.
Therefore, whether investors can recognize and reflect on their own weaknesses in their operations is the key to maintaining success and quickly correcting mistakes.
Many friends lose money in stock trading, buying leads to drops and selling leads to rises, mainly due to a lack of a correct trading model. To survive in a story of the weak eating the strong, one must have a set of profitable methods and self-protection discipline. If you want to learn more profitable models, such as the Double Dragon strategy, the upward pullback strategy, the main force control strategy, and the capital compound interest release method, understand the market and see the market's operational trajectory.
📱 Seize the opportunity, sign up immediately, and work with the experienced strategy team to explore certain opportunities amidst market fluctuations, responding calmly and rationally to the unpredictable cryptocurrency market.
