Japanese Candles: Predicting Trends and Analyzing Markets (Comprehensive Explanation Supported by Images)
Discover the most important types of Japanese candles in technical analysis and how to use them to predict trends in financial markets, enhancing your trading decisions.

Different types of Japanese candles are considered one of the most important tools for technical analysis in financial markets, as they provide an accurate visual representation of price movements over a specific time period. They are also distinguished by their high ability to reveal market sentiments and predict trends, whether bullish or bearish, aiding investors and traders in making the best informed investment decisions. Therefore, in our article, we will explore the types of Japanese candles in detail.
What are Japanese Candles?
Japanese candles are known as a type of chart used in technical analysis to represent the price movement of financial assets in the market, such as currencies, stocks, and commodities, over a specific time period. Each candle represents the following: opening price, closing price, lowest price, highest price, during that specified time period. Moreover, Japanese candles are distinguished by their ability to provide clear visual insights into price movements in the market, enhancing traders' and investors' ability to understand market dynamics, psychology, and trends.
Main Types of Japanese Candles
The main types of Japanese candles that help in market analysis and making the best informed decisions vary, and here we present them in detail:
Single Candles
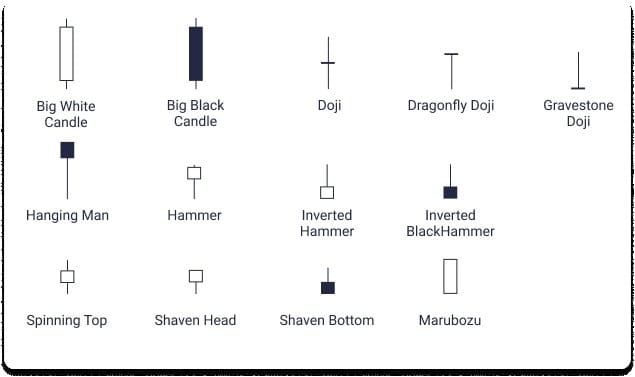
These candles are known for consisting of only one candle, and they provide important information and data about price movement over a specific time period, with some of the most notable types of these candles:
Hammer Candle: Characterized by a small body and a long lower shadow, it usually appears at the end of a downtrend, indicating the possibility of a reversal in the direction towards an uptrend.
Hanging Man Candle: Appears at the end of an uptrend, indicating a reversal in the direction towards a downtrend.
Doji Candle: Known for having almost no body or an extremely small body, where both the opening price and closing price are nearly equal, indicating a state of indecision in the market.
Composite Candles
These candles consist of multiple candlesticks and provide complex signals about market movements, with some of its most prominent patterns:
Bullish Engulfing Pattern: Consists of a bearish candle followed by a larger bullish candle, where the bullish candle completely engulfs the body of the bearish candle, indicating buyer strength and the potential for a price increase.
Bearish Engulfing Pattern: This pattern consists of a bullish candle followed by a larger bearish candle, where the bearish candle engulfs the body of the bullish candle, indicating seller dominance with the potential for a price decrease.
Reversal Candles
Reversal candles indicate a potential change in the current market direction. Some of the most notable patterns of these candles:
Shooting Star Candle: It has a small body and a long upper shadow, and it usually appears at the end of an uptrend, indicating a potential reversal in the direction towards a downtrend.
Inverted Hammer Candle: This candle appears at the end of a downtrend, indicating a reversal in the direction towards an uptrend.
Continuation Candles
Continuation candles indicate the continuation of the current trend in the market, with some notable patterns:
Three White Soldiers Pattern: Consists of three consecutive bullish candles, indicating the strength and continuity of the uptrend.
Three Black Crows Pattern: Composed of three consecutive bearish candles, indicating the strength and continuity of the downtrend.
The strongest types of Japanese candles for predicting trends
The strongest types of Japanese candles that help predict trends in financial markets are the following types:

Hammer Candle: This candle appears after a downtrend and indicates a bullish reversal.
Shooting Star Candle: This candle appears after an uptrend and indicates a bearish reversal.
Bullish Engulfing: Known for appearing after a downtrend and represents buyer strength.
Bearish Engulfing: Appears after an uptrend and indicates seller dominance.
Three White Soldiers: Indicates the continuation of the uptrend.
Three Black Crows: Indicates the continuation of the downtrend.

Technical Analysis Using Types of Japanese Candles
Technical analysis using types of Japanese candles relies on reading different candlestick patterns to identify market trends and predict future movements. Here, we present important information:
Reversal Candles: These candles indicate a potential change in direction, such as bullish engulfing or hammer candles.
Continuation Candles: These candles indicate the continuation of the current trend, with examples being Three Black Crows and Three White Soldiers.
Context: Analyzing the appearance of candles at resistance and support levels or with technical indicators enhances the accuracy of predictions.
Timeframes: Represented in models with long timeframes, known for high reliability compared to short ones.
Practical applications for using types of Japanese candles
There are many practical applications that can be listed regarding the use of different types of Japanese candles, and here are the most important ones:
Identifying Reversal Points
Traders can use reversal candle patterns like shooting stars or hammers to identify turning points in the market. For example, a hammer candle at a major support level can indicate the beginning of an uptrend.
Identifying Trend Continuation
Continuation candle patterns like Three Black Crows or Three White Soldiers are used to ensure that the current trend continues, supporting traders in benefiting from extended movements.
Support for buying and selling decisions
The appearance of a bullish engulfing pattern in a downtrend may be a strong signal encouraging buying, while a bearish engulfing indicates a significant selling opportunity.
Integrating Candles with Technical Indicators
Japanese candles enhance analysis accuracy, as they integrate with other tools like moving averages or the Relative Strength Index, providing more reliable signals for trading.

Analysis of Different Timeframes
Japanese candles can be used across different timeframes to confirm trends. For example, if a strong reversal candle appears on the weekly timeframe, it provides higher confidence in the market trend compared to limited and shorter timeframes.
Risk Management
Different types of Japanese candles play an important role in clearly defining entry and exit points, enhancing the placement of stop-loss orders at studied levels according to visible candle patterns.
Frequently Asked Questions:
How many types of Japanese candles are there?
There are 4 main types of Japanese candles: single candles, composite candles, reversal candles, and continuation candles.
How to Read Japanese Candles?
Japanese candles are read by analyzing the candle's body and shadows to analyze price trends, whether upward or downward.
What are Japanese candlestick charts?
Japanese candlestick charts are technical tools that show the price dynamics of various financial instruments in forex, stocks, commodities, and cryptocurrencies.
What does a candle without wicks mean?
A candle without wicks indicates the control of buyers over price movement from the beginning of the candle's opening until its closing.
 #Bitcoin2025 #BinanceAlphaAlert #BinanceHODLerSOPH #TrumpMediaBitcoinTreasury #WhaleJamesWynnWatch