
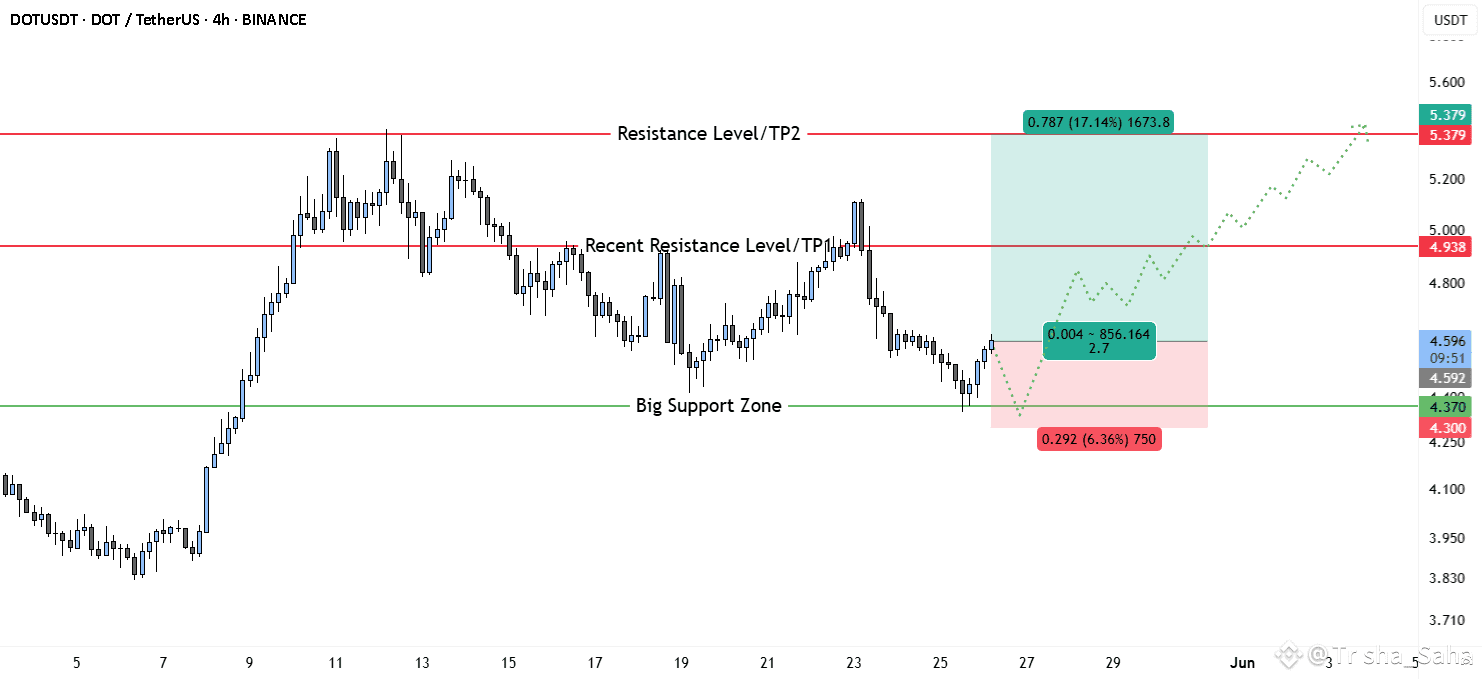
DOT/USDT is showing signs of a potential bullish reversal on the 4-hour chart, forming a strong setup for upward movement. Key technical levels and chart structures support this bullish outlook.
1. Strong Support Zone
• Zone: $4.30 – $4.37
• This area has acted as a major support, where buyers previously stepped in, leading to strong upward moves. Currently, the price has rebounded from this support zone, suggesting renewed bullish pressure.
• A bounce from this zone with increasing volume confirms the strength of this level and validates it as a demand zone.
2. Bullish Entry Setup
• The entry appears to be positioned slightly above the support zone, near $4.60.
• The risk-to-reward ratio is favorable (~2.7), indicating a well-placed setup for swing traders.
• A small stop-loss (~6.36%) below the support at $4.30 protects against a false breakdown.
3. Key Resistance and Target Levels
• TP1 / Recent Resistance: $4.93
This level marks a recent swing high and minor resistance. A breakout above this would confirm short-term bullish continuation.
• TP2 / Major Resistance: $5.38
This is the major resistance level and final take-profit zone. It aligns with a previous market top, and its breach could lead to further bullish continuation into a higher timeframe breakout.
4. Projected Path and Price Action
• The chart outlines a bullish projection path, anticipating higher lows and higher highs forming a stair-step rally.
• This dotted path suggests a bullish trend structure with gradual momentum buildup.
• Buyers may continue pushing the price upward through TP1 toward TP2 in the coming sessions, especially if macro conditions or Bitcoin price action remain favorable.
5. Market Structure & Candlestick Behavior
• The market recently transitioned from a short-term downtrend into a consolidation phase.
• Bullish candlestick formations around the support zone imply accumulation.
• The recent bullish engulfing near the support further confirms buyer dominance and a potential trend reversal.
6. Risk Management and Outlook
• Stop-Loss: Below $4.30 to manage downside risk.
• Target Zones: $4.93 (TP1), $5.38 (TP2).
• A break below $4.30 would invalidate the bullish thesis and suggest caution.
• As long as DOT remains above the $4.37 zone, the bullish scenario remains intact.
Conclusion
DOT/USDT is currently in a bullish setup on the 4-hour chart with a high-probability reversal from the support zone. Traders may look for confirmation candles and volume support to enter long positions with TP1 at $4.93 and TP2 at $5.38. Risk remains contained below the $4.30 level.