
Solana (SOL) is down 5% over the past seven days and has traded below $180 for six consecutive days. Despite this, institutional interest in SOL is rising, with large players accumulating and staking significant amounts ahead of a potential altcoin season.
However, technical indicators are showing signs of weakness, including a negative BBTrend, a bearish Ichimoku Cloud setup, and a looming EMA death cross. These mixed signals suggest that while long-term confidence is growing, short-term momentum remains under pressure.
Solana Draws Institutional Interest, But Ichimoku Cloud Signals Uncertainty
Institutional accumulation of Solana is intensifying in May 2025, signaling strong confidence ahead of a potential altcoin season.
Despite altcoin trading volumes remaining below previous peak levels, major players have been stacking SOL—staking large amounts and adding to long-term holdings.
Over 65% of SOL’s supply is now staked, and Q1 2025 app revenue reached $1.2 billion, the strongest in a year. These trends, combined with positive on-chain flows and ecosystem expansion, position Solana as a frontrunner if altcoin momentum returns.
 SOL Ichimoku Cloud. Source: TradingView.
The Ichimoku Cloud chart for Solana currently reflects market indecision with a slight bearish tilt. Price action is hovering inside the green cloud, suggesting consolidation and a lack of clear direction.
The blue Tenkan-sen (conversion line) sits below the red Kijun-sen (baseline), indicating short-term weakness. The Chikou Span (green lagging line) is tangled in recent price action, reinforcing the neutral-to-bearish bias.
Ahead, the cloud shifts to red and appears flat, pointing to potential resistance and low momentum unless a strong breakout occurs.
SOL BBTrend Stays Negative, Bearish Momentum Holds Below -4
Solana’s BBTrend is currently at -4.31, marking its third consecutive day in negative territory.
Over the past several hours, the indicator has remained stable around -4, suggesting consistent bearish pressure in the short term.
 SOL BBTrend. Source: TradingView.
The BBTrend (Bollinger Band Trend) measures the strength and direction of price movement relative to the width of the Bollinger Bands.
Values above 0 typically indicate bullish momentum, while values below 0 signal bearish momentum. A BBTrend at -4.31 reflects strong downward pressure and limited volatility expansion to the upside.
If this trend continues, it may point to further consolidation or even a deeper pullback unless a sharp reversal breaks the pattern.
Death Cross Setup Could Push SOL Back To $141 If $160 Support Fails
Solana’s EMA lines are converging and could soon form a death cross, a bearish technical signal where the short-term EMA crosses below the long-term EMA. If that occurs, SOL price could test the support level at $160.
A breakdown below this level could push the price down to $153.99, and if bearish momentum accelerates, Solana may decline further toward $141.
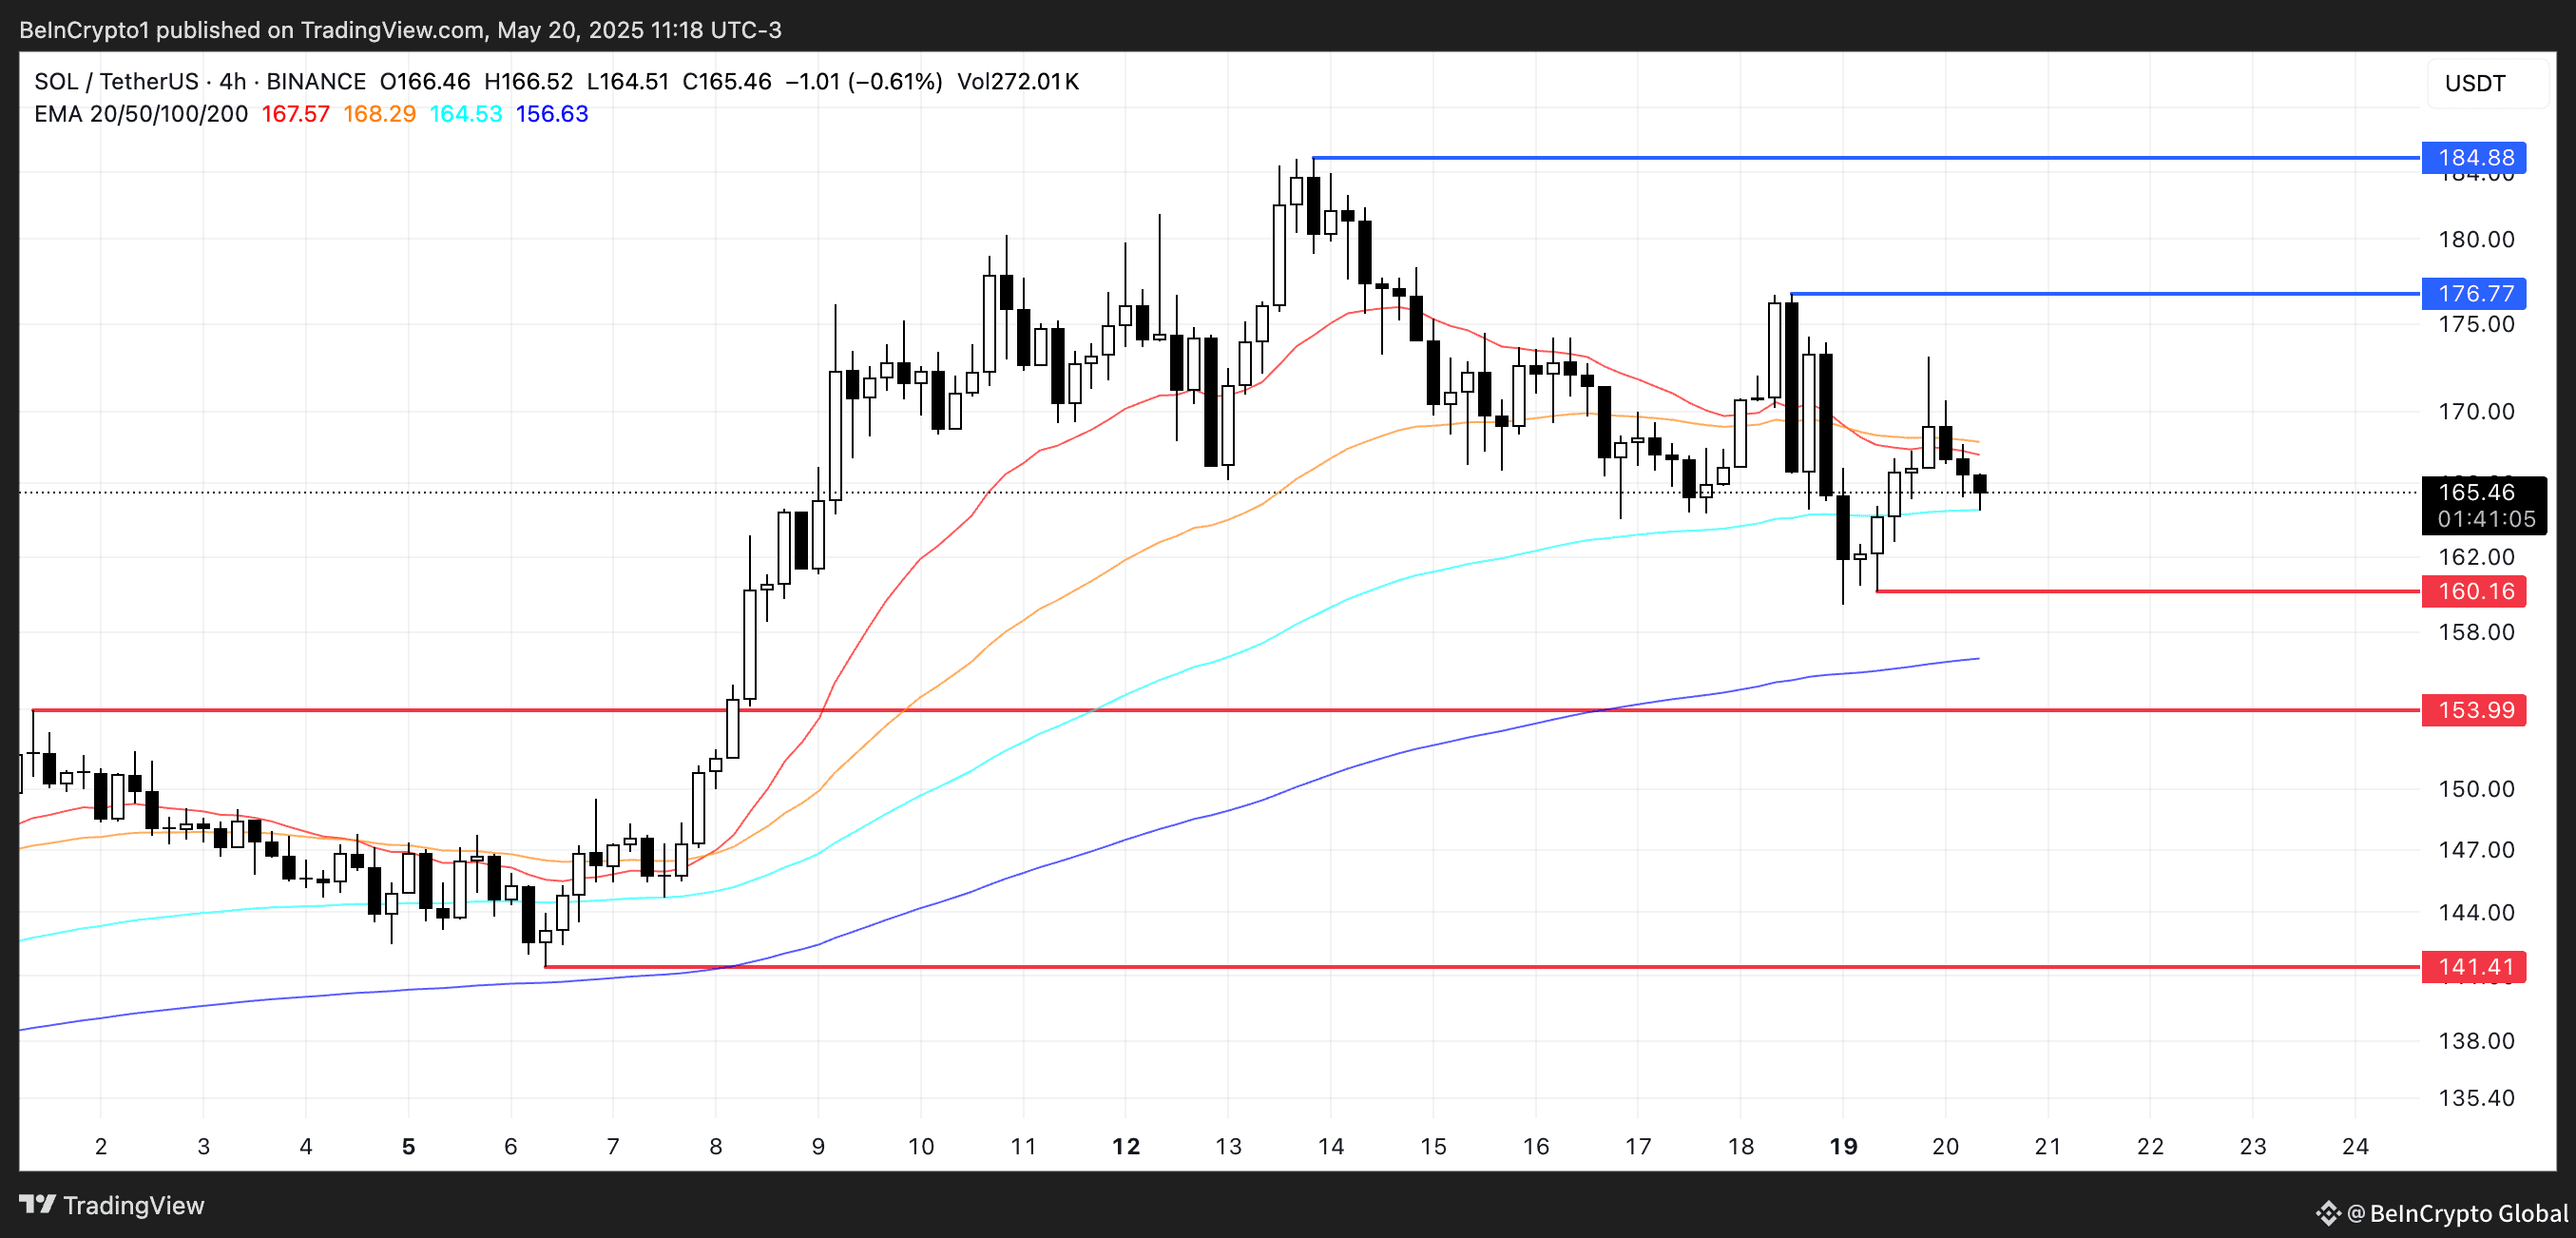 SOL Price Analysis. Source: TradingView.
On the other hand, if Solana regains bullish momentum, the first resistance to watch is at $176.77.
A successful breakout above this level could open the door for a further rally toward the $184.88 zone.
