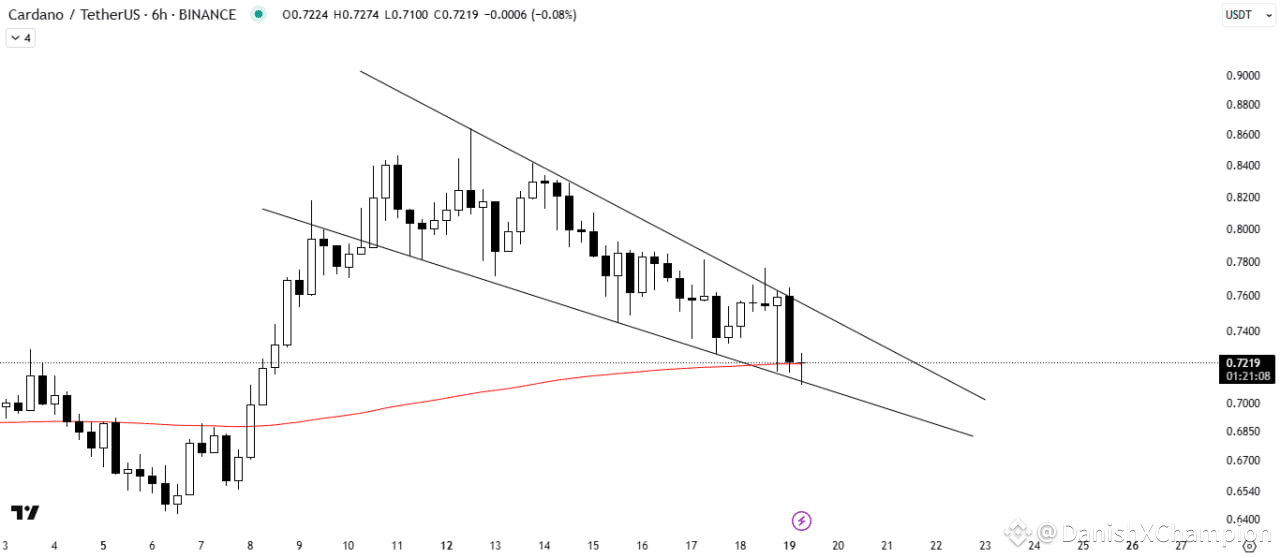
The provided 6-hour chart of Cardano (ADA) against Tether (USDT) on the Binance exchange reveals a bearish trend, with the price currently trading at $0.7219. The chart displays a downward sloping channel, indicating a consistent decline in ADA's value over the observed period.
Key Observations:
- *Downward Sloping Channel:* The price action is confined within a downward sloping channel, characterized by lower highs and lower lows. This pattern suggests a strong bearish sentiment in the market.
- *Recent Price Movement:* The most recent candlesticks show a continuation of the downtrend, with the price failing to breach the upper boundary of the channel. This indicates a lack of buying pressure and a dominance of selling activity.
- *Support Level:* The horizontal dotted line at approximately $0.7400 has acted as a support level, but the price has recently broken below it. This breach could lead to further downward pressure.
- *Red Line Indicator:* The red line, likely representing a moving average, is trending upwards but remains below the current price. This could indicate a potential support level or a sign of a possible reversal.
Technical Analysis:
The chart's technical indicators suggest a bearish outlook for ADA in the short term. The downward sloping channel and the recent break below the support level at $0.7400 are negative signs. However, the upward trending red line could provide some support and potentially lead to a reversal.
Conclusion:
Based on the analysis of the 6-hour chart, the current trend for Cardano (ADA) is bearish. The price is likely to continue its decline unless it can break out of the downward sloping channel and sustain a move above the resistance levels. Traders and investors should exercise caution and consider the potential risks before making any investment decisions.