

In crypto, knowing where capital is flowing is critical. That’s why I often compare BTC Dominance (BTC.D) and ETH/BTC — two charts that have a high probability of moving in reverse.
Here’s why this relationship matters:
Understanding the Inverse Dynamics
🔹 BTC.D measures Bitcoin’s share of the total crypto market
🔹 ETH/BTC tracks the strength of Ethereum against Bitcoin
These two charts often move in opposite directions, creating a mirror effect in market sentiment.
Why ETH Has a Major Impact on Altcoins
🔹 ETH accounts for a massive portion of total altcoin market cap
🔹 When ETH/BTC rises, ETH pulls money away from BTC, usually boosting other altcoins
🔹 When BTC.D rises, it indicates BTC is outperforming alts, often at the expense of ETH
This means the ETH/BTC pair largely determines the strength of the broader altcoin market.
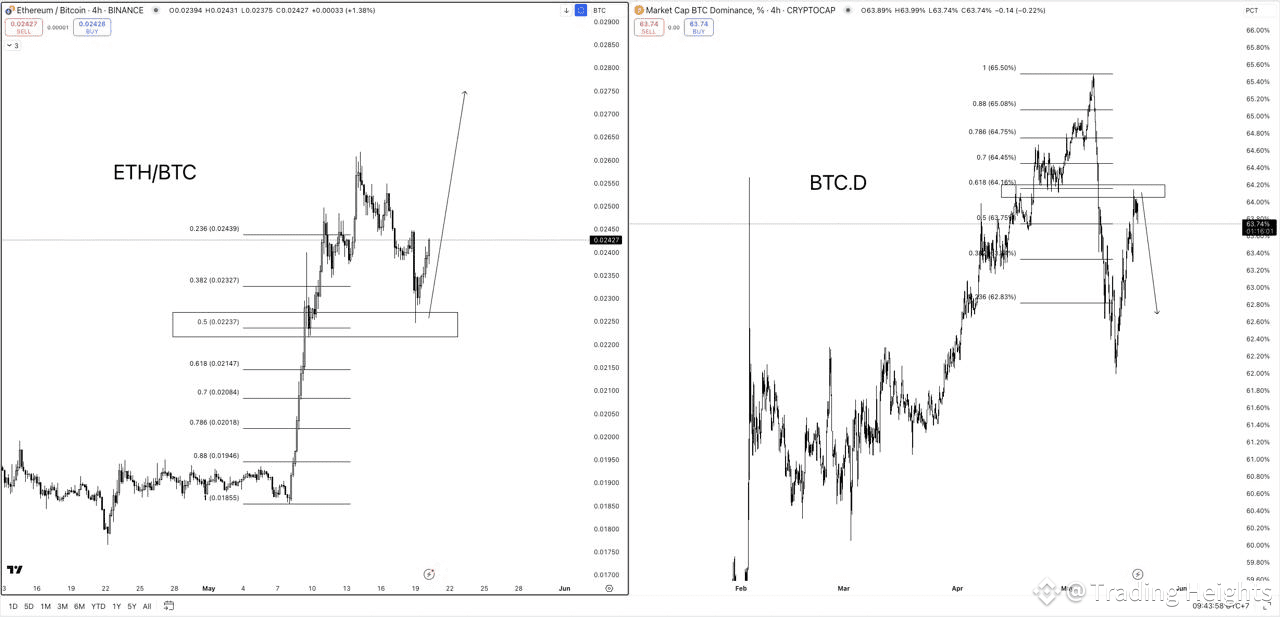
Current Technical Setup
🔹 ETH/BTC recently corrected to the 50% Fibonacci level — a classic support zone
🔹 BTC.D found support at the 61.8% Fibonacci level — another key retracement level
Both charts are showing signs of a potential trend reversal, confirming the inverse relationship.
Why This Matters for Your Trading Strategy
🔹 A rising BTC.D typically signals capital rotating back into Bitcoin — often bearish for alts
🔹 A rising ETH/BTC suggests altcoin dominance is returning — a sign of incoming altseason
🔹 Watching these two charts together can give you an edge in timing altcoin entries and exits
Final Thoughts
🔹 Use the BTC.D and ETH/BTC pairing to gauge market sentiment
🔹 Track these relationships to predict altcoin strength
🔹 Stay flexible and adjust as the charts develop
Disclaim: All information provided is for reference only. No financial responsibility is taken.

