Still guessing where the price will go?
What if I told you the chart is already telling you — in shapes!
Welcome to Day 1, where we turn triangles, tops, and bottoms into your trading superpower.
Think of chart patterns like signs. They tell you:
Price might go up
Price might go down
Or price might stay flat for a while

---
What is a Chart Pattern?
It’s a shape on the chart that shows how people are buying or selling.
When many people do the same thing, a pattern forms.
These patterns help traders guess the next move – like watching clouds to guess if it’ll rain.
---
Popular Chart Patterns
1. Triangle – Not a Snack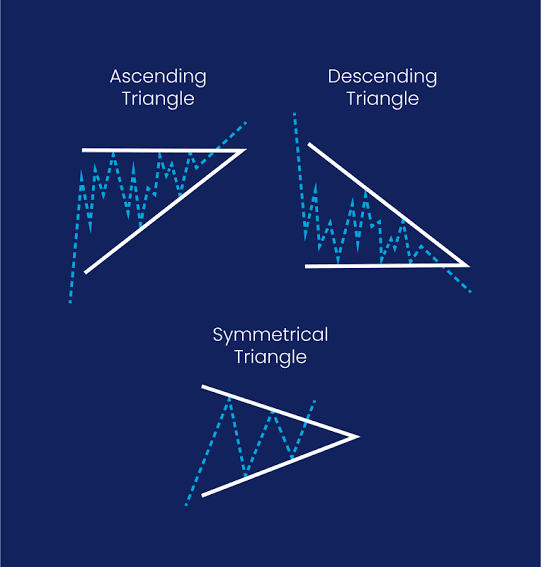
Price is getting ready to move. Big move coming soon!
Example: Imagine two people arguing. They get closer and closer until one of them yells and walks away – that's the breakout!
---
2. Head and Shoulders – Not Shampoo!
The price was going up, but now it wants to go down.
Example: Think of someone lifting weights. After lifting too much, they drop everything. That’s the price giving up.
---
3. Double Top – “I Tried… Twice”
Price went up twice but failed both times. Now it’s tired and goes down.
Example: Like someone asking the same girl out two times and getting rejected. After that? They walk away.
---
4. Double Bottom – Time to Rise

Price hit the same low spot two times. Then it goes up.
Example: Like falling down, getting up, falling again… then saying, “No more! I’m rising!”
---
Important Questions & Simple Answers
Q1: How do I know it’s a real pattern?
A: Wait for confirmation. If price breaks out with strong volume (lots of trades), it’s serious.
---
Q2: What if I’m late?
A: Don’t chase the trade. Wait for the price to come back and test the level again (retest).
Funny Tip: If the train left, don’t run. Wait for the next one.
---
Q3: Are patterns always right?
A: No. They are just tools. Use stop-loss to stay safe. Trading is about smart plans, not magic.
---
Q4: Can I use patterns without indicators?
A: Yes! Patterns + support/resistance + volume = good combo.
---
Q5: What’s a big mistake new traders make?
A: Seeing patterns that are not real. If you see a “dragon” on the chart, take a break!
---
Quick Recap Table
Pattern Meaning Direction to the Chart.
Triangle Big move coming Up/Down Price is building pressure.
Head & Shoulders Reversal down Down Price is tired.
Double Top Rejection twice Down Price failed twice.
Double Bottom Support holding UpPrice said “No more falling”
---
Your Homework
Open any chart (BTC, ETH, etc.)
Try to find 1 pattern from today’s lesson
Ask yourself: “Would I trust this pattern with my money?”
If yes – test it.
If not – keep practicing.
---
See you tomorrow for Day 2: Candlestick Patterns
We’ll learn what each candle is trying to tell you (yes, they have feelings too).
Still confused or spotted a weird pattern that looks like a dinosaur?
Drop your questions in the comments – no judgment, only learning!
Follow for the full 24-Day Bootcamp
Like if chart patterns finally make sense
Share with your trading buddy who still buys the top
Let’s turn smart entries into a habit — not luck.