Last night's market was another very exciting dual explosion phase of long and short positions, good thing the section chief provided market analysis in advance. Everyone in the B community has gained something to varying degrees. First, if it stabilizes above 104300, one can follow the trend and go long to 105400. In the second half of the night, it directly dropped more than 2000 points from around 105600, and this morning it punctured to the resistance level of 107200 we provided last night, dropping more than 3000 points again.
The two resistance levels of 105400 and 107200 are very accurately assessed by the section chief. We mentioned last night that 177 is a resistance for SOL, and 165 and 163 can be used for long positions to gain a few points without any problem. Last night, it also dropped from around 176.7 to 164.5 before starting to rebound to 174. Those who followed along can basically enjoy a wave.

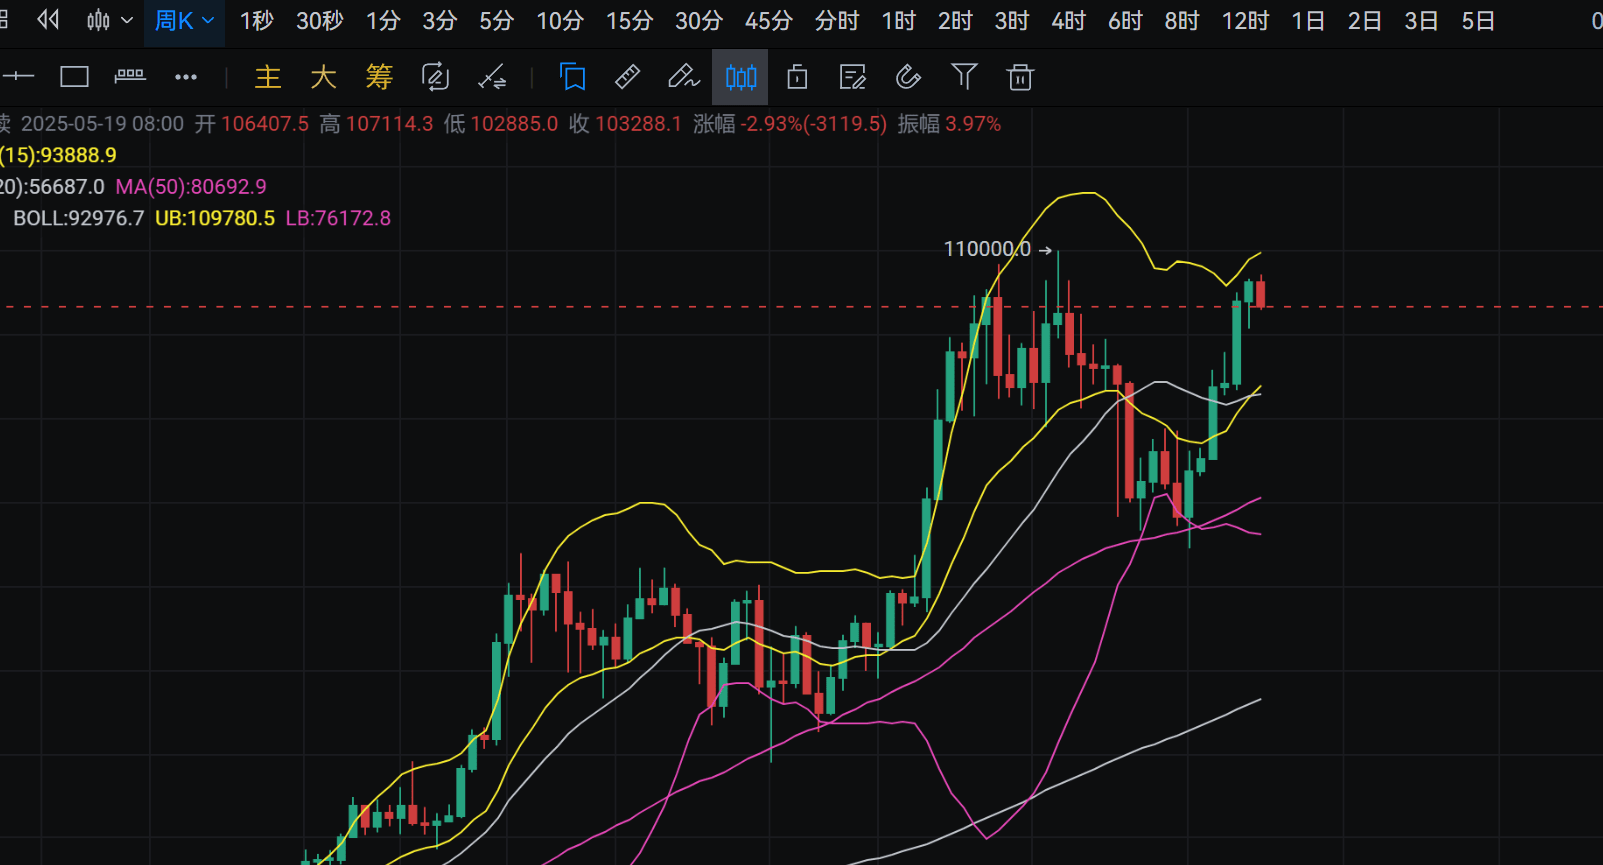
After the dual explosion of long and short positions, how should we view the current market? Let's first look at the weekly level. Last week's weekly chart closed in the green, and it was the second bullish candle that opened the BOLL mouth. Therefore, we can expect this week's weekly chart to close in the green again, making Bitcoin's ATH really not far from us. If the weekly chart closes in the green again this week, June and July will undoubtedly be the main upward wave at the weekly level, and the bull market will return!
Let's take a look at the daily market. First, on the moving averages, the cross of MA120 and MA50 has become unstoppable. And with the continuous support of EMA15, the bullish trend is launching another all-out attack, and we can wait and see!

In terms of the MFI and CCI market, the MFI trend has launched another upward attack. As for the CCI, although it has declined with the morning trend, the daily trend has not dropped below the zero axis. Therefore, we cannot be overly bearish at the moment. Given CCI's weaknesses, the later market will likely still show an upward fluctuation pattern, pulling up a bullish candle, consolidating for a few days, then pulling up another bullish candle, and consolidating for a few days again.

In the short-term daily trend of Bitcoin, short-term support is at 102700 and 101600. The bottom-buying position is at 100800. Short-term resistance is at 104700 and 105600.

In the short-term daily trend of SOL, support is still focused around 163.2, with short-term resistance at 168 and 170 above.

In summary, the overall bullish trend on the daily chart has not changed, and the short-term CCI trend tells us that the probability of an upward fluctuation is greater.


