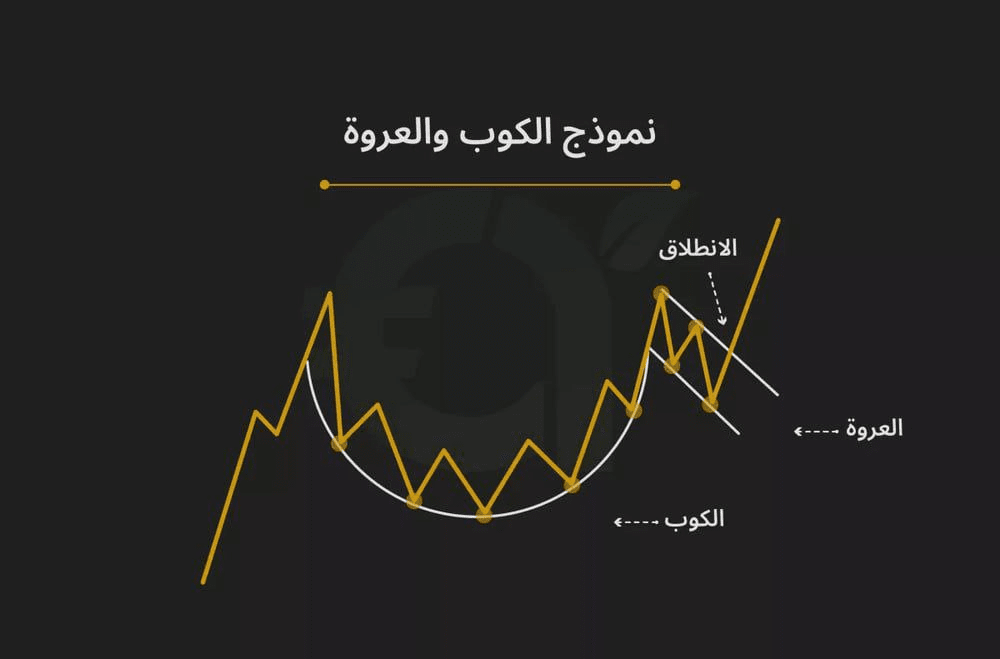
The cup and handle pattern is one of the most famous technical patterns in technical analysis, considered a bullish continuation pattern that often appears after a strong upward wave, indicating that another rise is coming after a period of consolidation or correction.
What does the pattern consist of?
1. The cup:
Resembles a circular or semi-circular bottom.
Forms after a strong rise followed by a temporary drop (approximately 50% correction).
Followed by another rise that completes the cup shape.
2. The handle:
Formed on the right side of the cup.
Represents a simple correction in price movement, and may appear as a triangle, flag, or even a small bottom.
After its completion, a price breakout upwards is expected.
The goal of the pattern:
Used to identify strong buying opportunities after the price breaks above the handle.
The price target is determined by measuring the depth of the cup and adding it above the breakout point.
Its features:
A continuation bullish pattern, not a reversal as some may think.
Helps discover long-term opportunities, especially when used on large time frames.
When does it appear?
During the uptrend, after a wave of rise and natural correction.
Indicates that the market needed a rest before continuing to rise.
How to identify it?
There is no mathematical formula, but it can be easily visually identified on the chart.
What happens after the breakout?
A price increase usually follows the breakout, but it is always better to look at the larger time frame to confirm the overall trend.
Summary:
The cup and handle pattern is a powerful tool for the smart trader, indicating a pause in the upward trend before a new breakout. Those who master it know when to enter confidently... and when to take profits!