Right now, $XRP is hovering around the $2.36 mark, stuck in a neutral zone without a clear direction. With the market showing signs of both hesitation and potential, it's time to dig deeper into the charts and see what could be coming next.
XRP Technical Analysis – Key Levels in Focus
Recently, XRP slipped below a key support zone at $2.44, which hints at some short-term bearish pressure. Currently, it's trying to find a solid footing near the $2.30 level. If this support fails, we could be looking at a further drop towards the $2.10–$2.15 zone, where stronger buying interest might step in.
On the flip side, the first resistance to watch now sits between $2.43 and $2.44. A push above this range could open the door for a retest of $2.60—a significant level that has held strong in recent months.
Fibonacci Resistance – The Golden Pocket Zone
Using the Fibonacci retracement tool, there’s a key resistance area between $2.55 and $2.62, known as the “golden pocket.” This zone often acts as a major turning point in the market. A strong move above $2.62, especially with a confirmed daily close, could spark a bullish rally. If that plays out, $XRP might climb toward $2.90 in the near term.
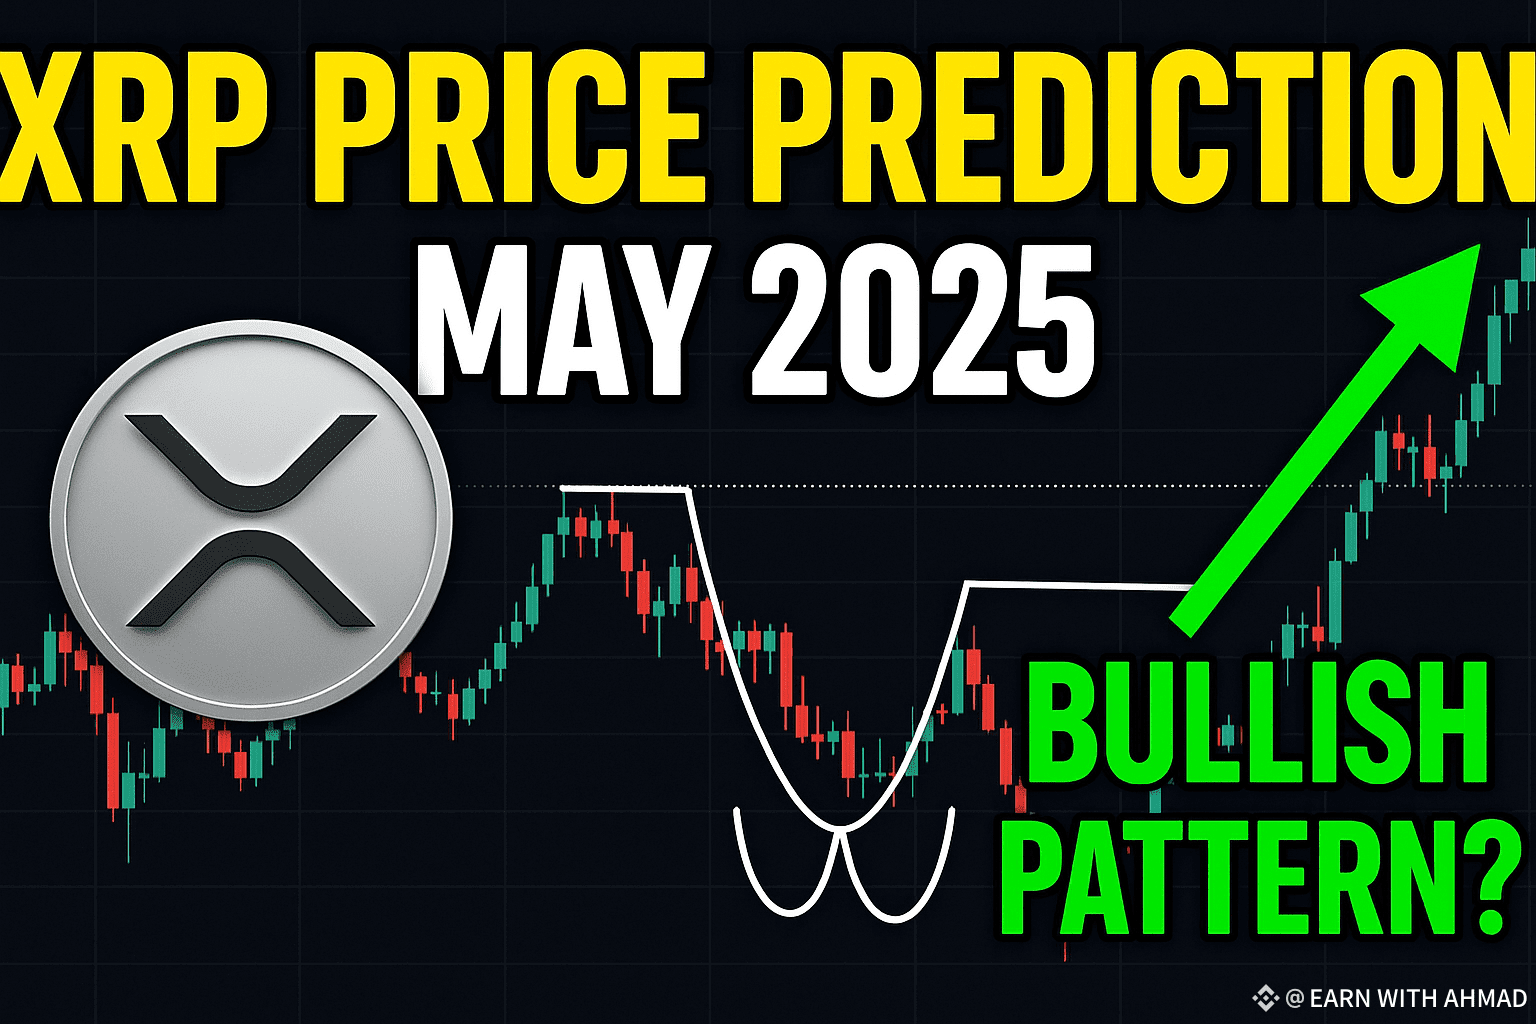
A Bullish Pattern in the Making?
There’s also a potential bullish setup forming—a classic inverse head and shoulders pattern. While it hasn’t fully formed yet, the conditions are shaping up:
XRP would first need to dip into the $2.10–$2.15 region.
Then, we’d need to see a solid bounce back towards $2.60.
Finally, a confirmed breakout above $2.60 would complete the pattern.
If this plays out as expected, it could be the catalyst for a major uptrend, possibly sending XRP above $3 and aiming for new all-time highs.
Final Thoughts
XRP is at a crossroads right now. With crucial support and resistance levels in play and a potential bullish pattern forming, May could turn out to be a defining month for the token. Keep an eye on the $2.10–$2.60 range—it might just decide XRP’s next big move.