Can you really draw lines? Only after reading will you truly learn how to draw lines! 🎈
[Supplement] The previous article ( Overview of Chán Theory Concepts ) helped students understand what Chán theory is and most of the knowledge points involved in it. It is recommended to start from the beginning, as this will help you build the overall framework for learning Chán theory from scratch. This article will start from the most basic elements in Chán theory: 笔, formations, and segments.
First, let me explain why 'different people have different waves' and 'different people have different Cháns'? Because many people are not clear about what an effective K-line is, and which K-lines can be ignored or merged? Therefore, the lines you draw and the support and resistance you find are all invalid signals. So, on what basis can you achieve stable profits amidst the complexities of the market?
Creation is not easy. Students who wish to pursue progress and stable long-term profits can follow along, give a three-click support 🥳, and the square live broadcast at 8 PM every night will not only provide you with precise support and resistance but will also explain the day's teaching articles on Chán theory.
[Main Text] First, I respectfully present this chapter's original text on Chán theory!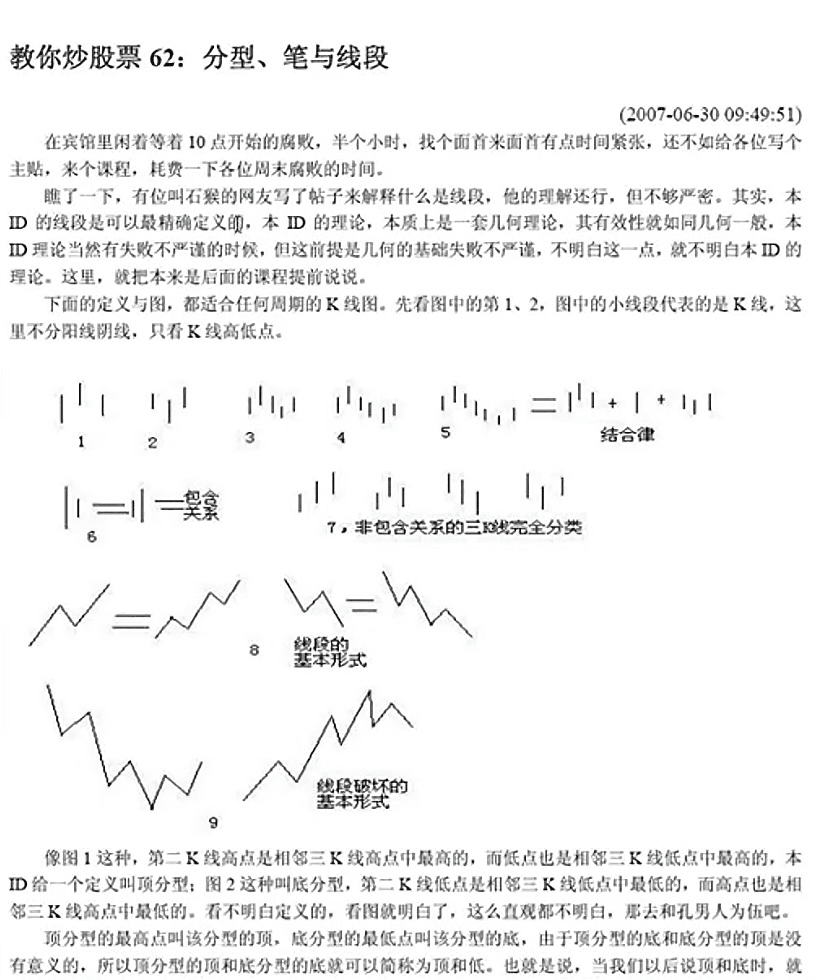
Figure 1 - Original text of Chán Theory Lesson 62 (Part 1) 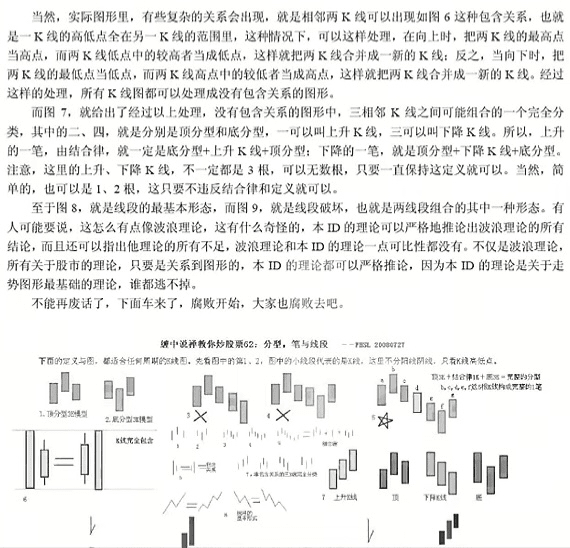
Figure 2 - Original text of Chán Theory Lesson 62 (Part 2)
1. The meaning of peak formations and trough formations:
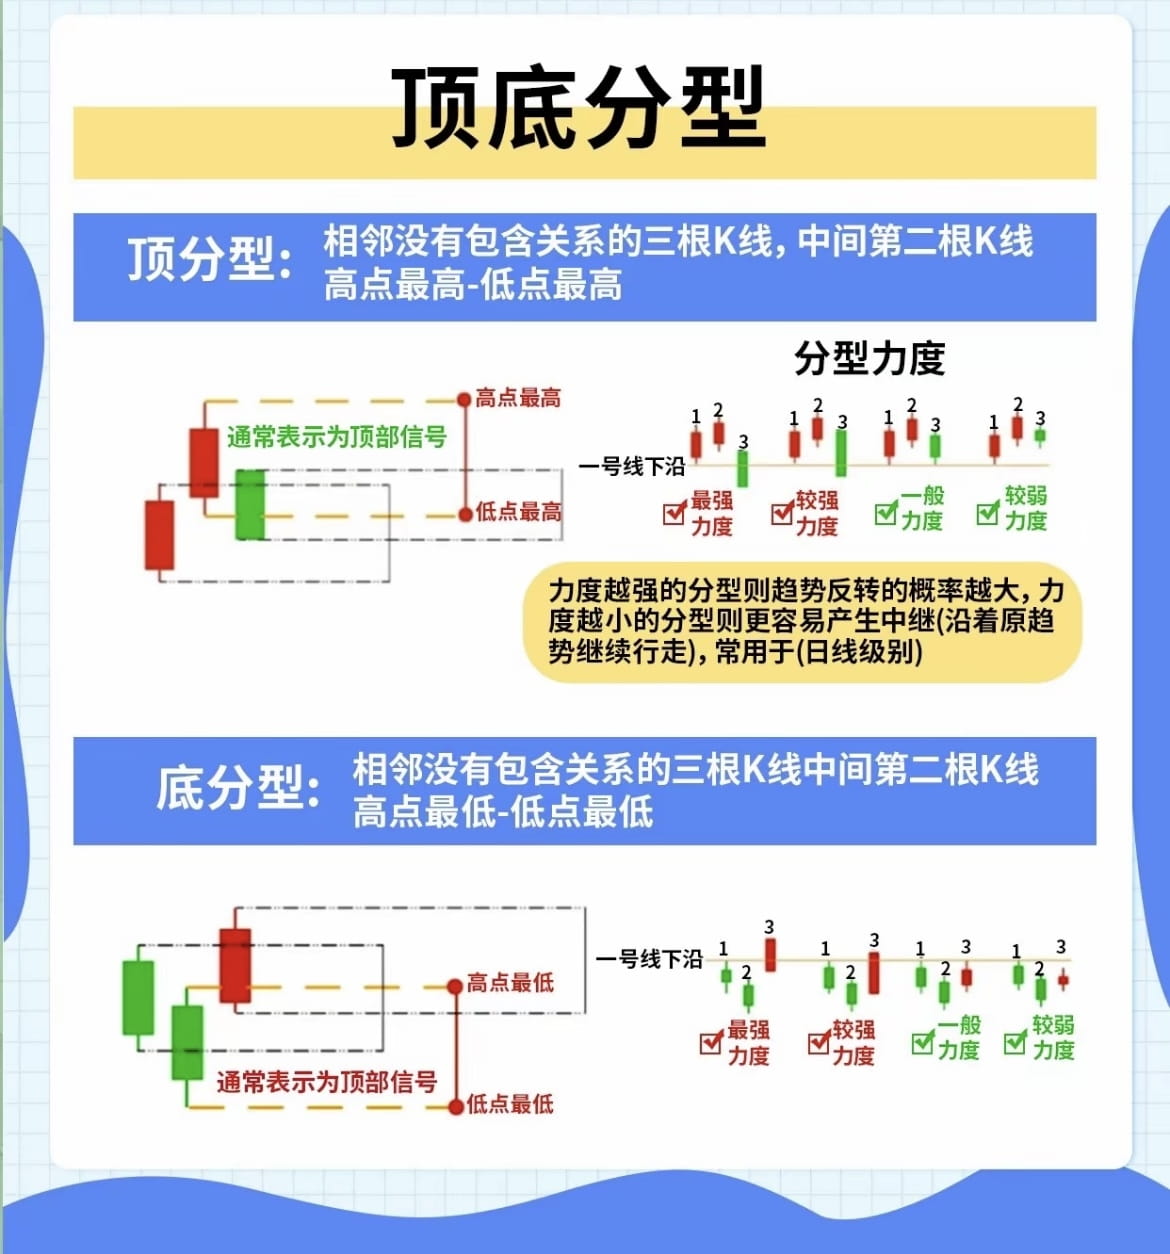
As shown in Figure 3, as the name suggests, 'peak formations' often appear after any level of uptrend, while 'trough formations' often appear after any level of downtrend. It is especially important to note that three adjacent K-lines without an 'inclusion relationship' (including upper and lower shadows) must meet the requirements of Figure 3 to be called peak formations or trough formations. Peak and trough formations only look at K-lines, regardless of whether they are bullish or bearish. The highest point of the K-line in the middle of a peak formation is called the peak of that peak formation, and the lowest point of the K-line in the middle of a trough formation is called the trough of that trough formation.
2. What is the inclusion relationship between K-lines and how to handle the inclusion relationship between K-lines?
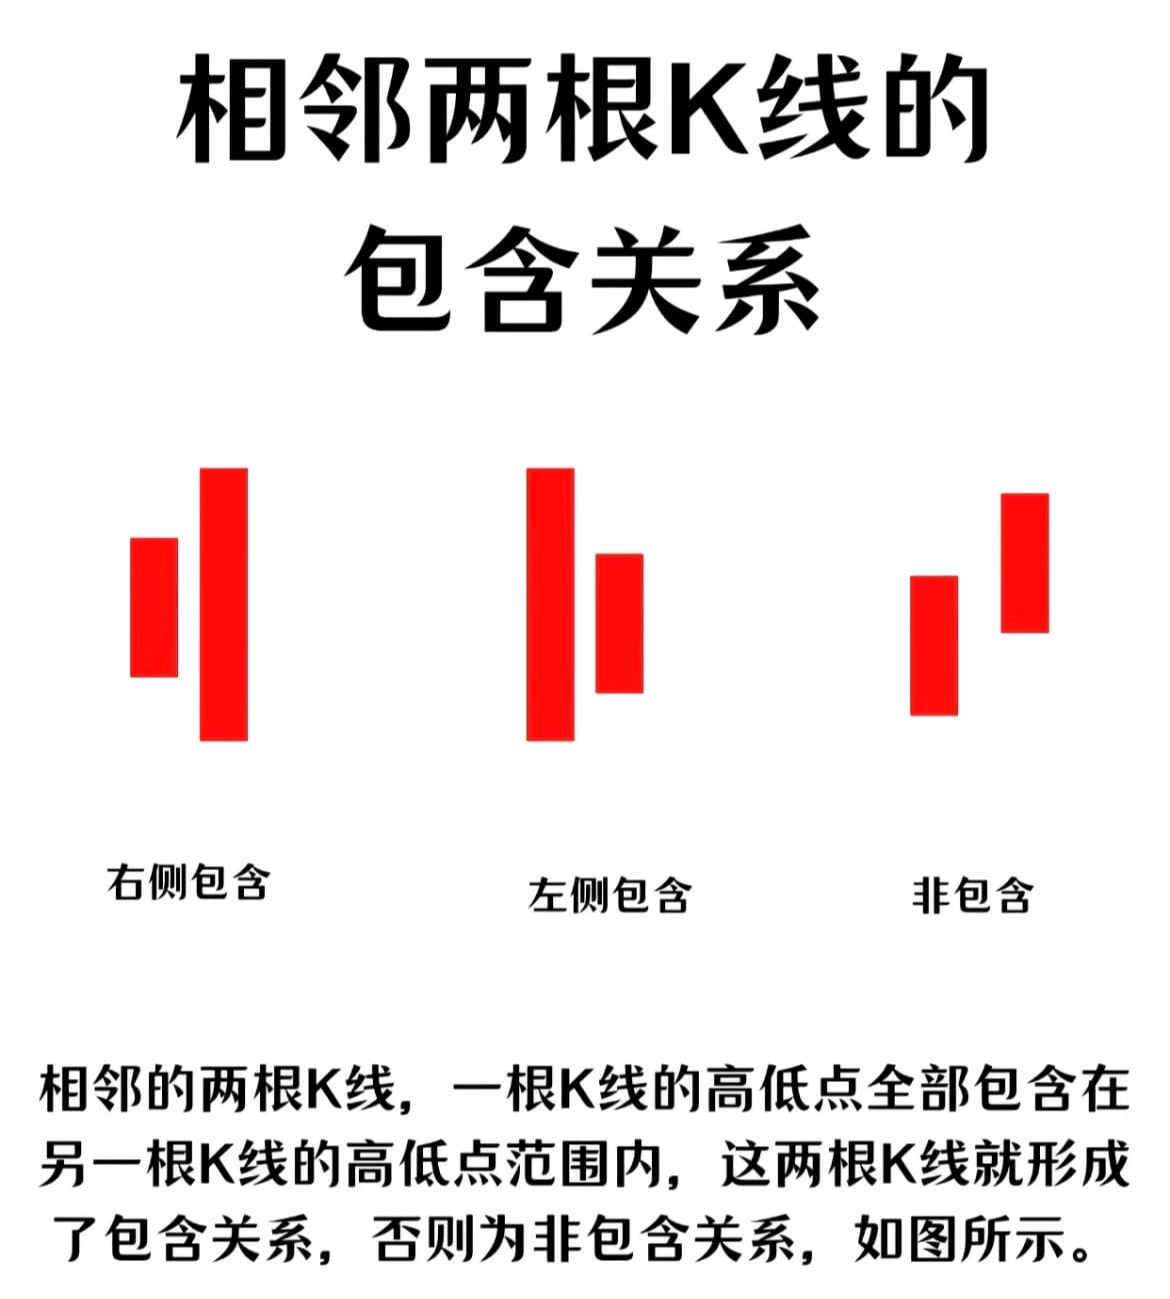
As shown in Figure 4: The inclusion relationship means that in two adjacent K-lines, the high and low points of one K-line are within the high and low point ranges of the other K-line (including upper and lower shadows), which means there is an 'inclusion relationship'. Whenever an inclusion relationship appears, 'inclusion processing' must be performed. Next, I will explain in detail how to perform 'inclusion processing' on K-lines that have an 'inclusion relationship':
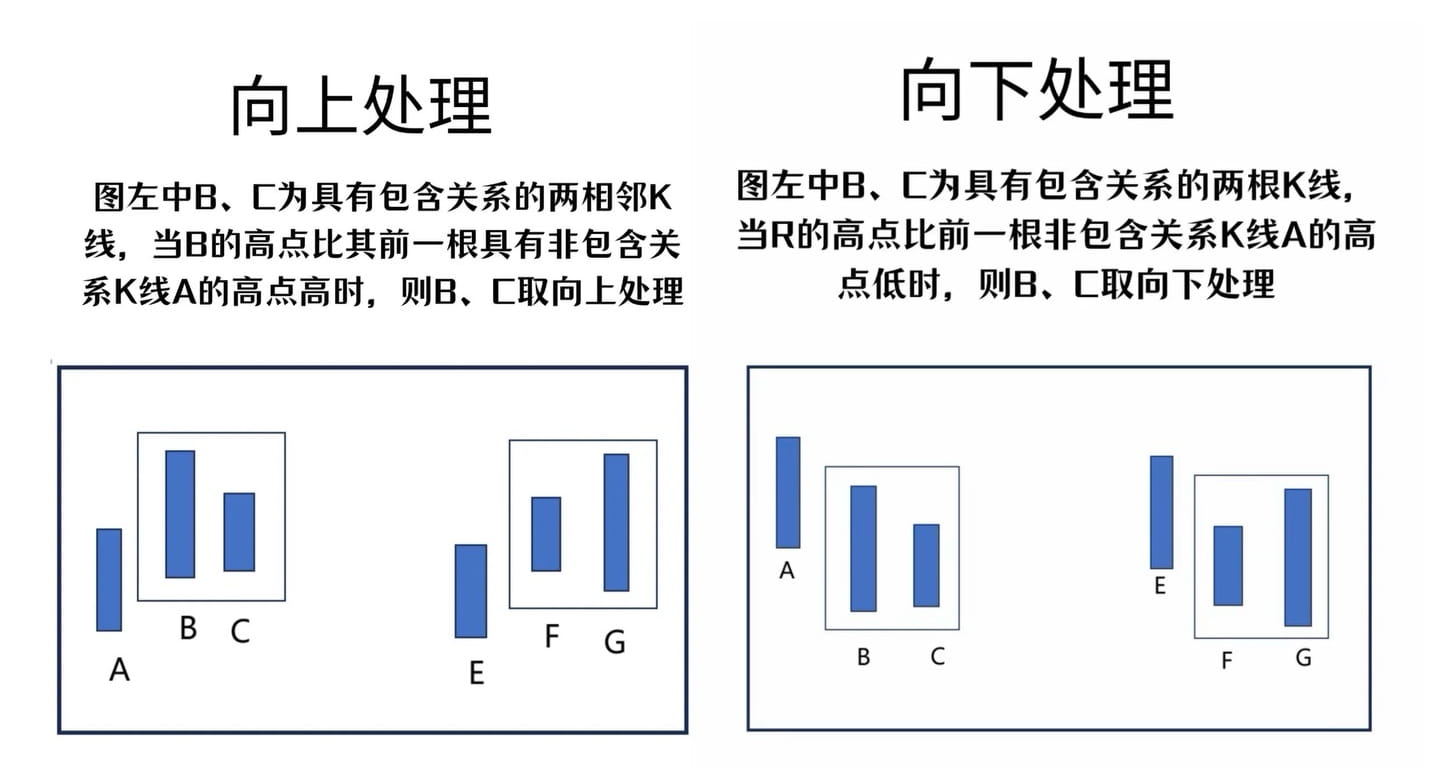
As shown in Figure 5: Inclusion processing is divided into 'upward processing' and 'downward processing'. Before performing 'inclusion processing', you first need to distinguish whether the market trend before the two K-lines that have an inclusion relationship is upward or downward: Compare the high point of the middle K-line with the previous K-line; if it is higher, it is an uptrend, and if it is lower, it is a downtrend.
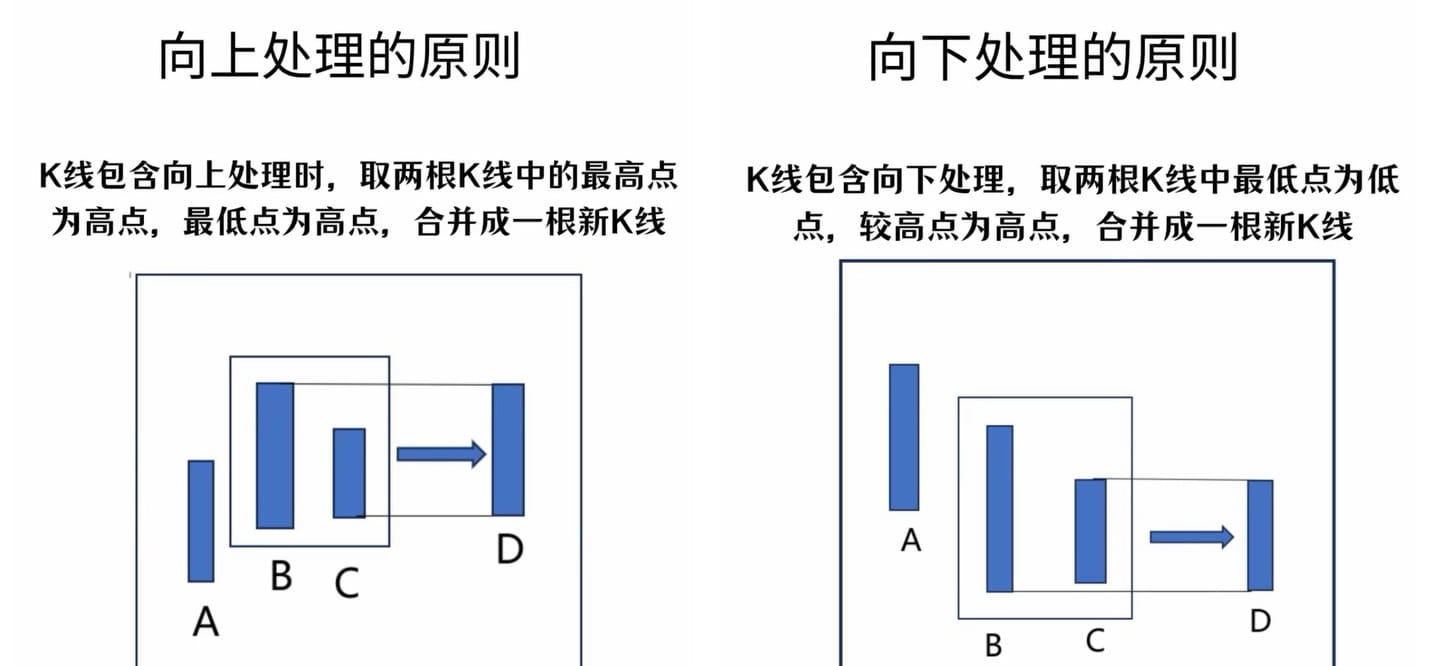
As shown in Figure 6: In an uptrend, the higher of the two K-line peaks is taken as the high point, and the higher of the two K-line troughs is taken as the low point for upward 'inclusion processing', referred to as 'high-high takes high, low-low takes high'; conversely, in a downtrend, the lower of the two K-line troughs is taken as the low point, and the lower of the two K-line peaks is taken as the high point for downward 'inclusion processing', referred to as 'low-low takes low, high-high takes low' (Note: inclusion processing can only be performed after the current K-line has completed).
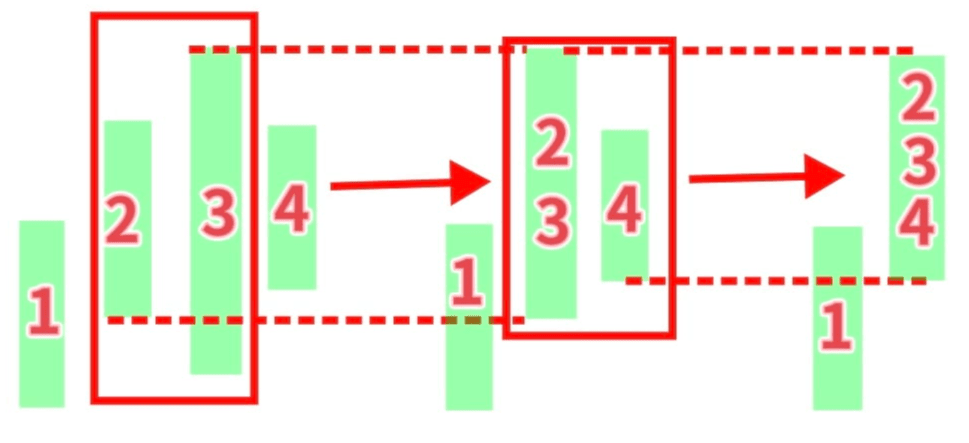
However, in actual market movements, more complex continuous 'inclusion relationships' often occur. As shown in Figure 7, at this time, it is necessary to remember that all handling of inclusion relationships must prioritize handling the 'inclusion relationships' on the left side. After handling the left side's 'inclusion relationships', then use the processed new K-line to perform 'inclusion processing' with the subsequent K-lines.
3. What is a '笔'? How to draw a '笔'?
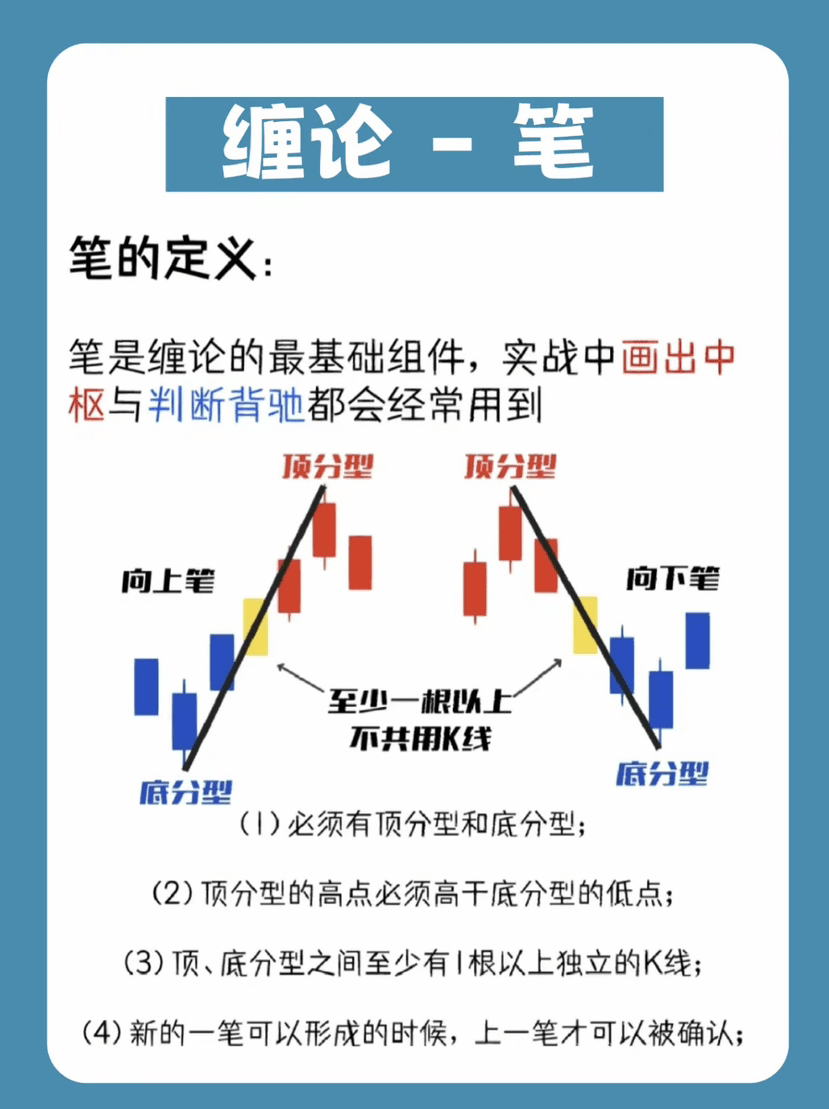
What is a '笔'? As shown in Figure 8, the definition of '笔' is: 'consecutive' two peaks and trough formations with at least one K-line between them, the line connecting the peak and trough of this formation constitutes a '笔', meaning that a 'peak' is inevitably linked to a 'trough'; only after the next '笔' appears can the completion of the previous '笔' be fully confirmed. If there is no at least one K-line between adjacent peak and trough formations, a '笔' cannot be drawn.
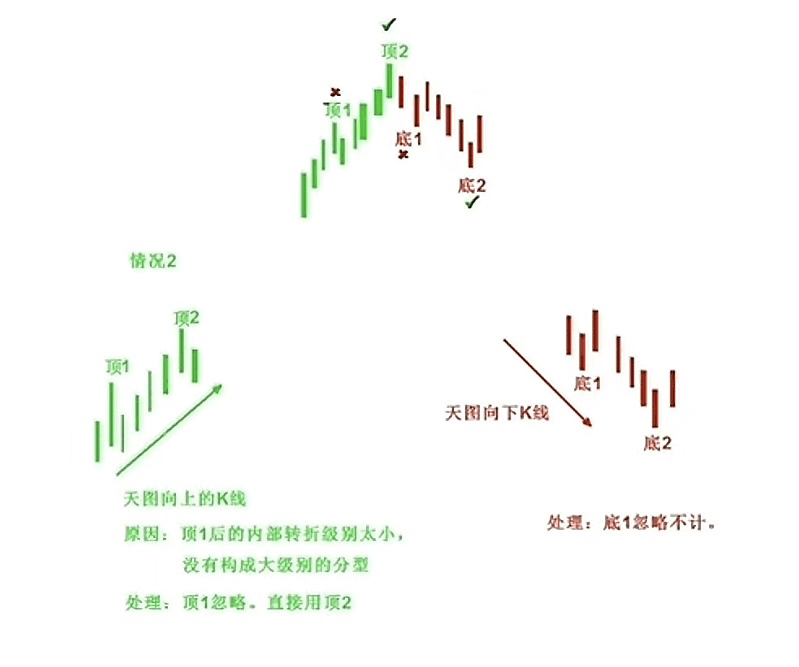
We often encounter more complex 'peak' and 'trough' structures in the market. As shown in Figure 9: In a segment of an uptrend, 'peak formations' frequently appear, or in a segment of a downtrend, 'trough formations' frequently appear. Then the next trend will definitely show a 'peak formation' that temporarily ends this uptrend and a 'trough formation' that temporarily ends this downtrend. At this time, the 'peak formations' in the middle of the uptrend or the 'trough formations' in the middle of the downtrend can be directly ignored. You can directly connect the starting 'trough' to the ending 'peak' or the starting 'peak' to the ending 'trough'; if both 'peak formations' and 'trough formations' appear in the middle, we need to strictly measure whether these 'peaks' and 'troughs' in the middle of the uptrend meet the requirements for drawing a '笔'. If they do not meet the requirements, then when drawing the '笔', you can ignore the 'peak formations' and 'trough formations' in the middle and directly connect the starting 'trough' to the ending 'peak'; if they meet the requirements for drawing a '笔', then more '笔' will appear in this segment of uptrend or downtrend.
4. What is a 'segment'? And how to draw a 'segment'?
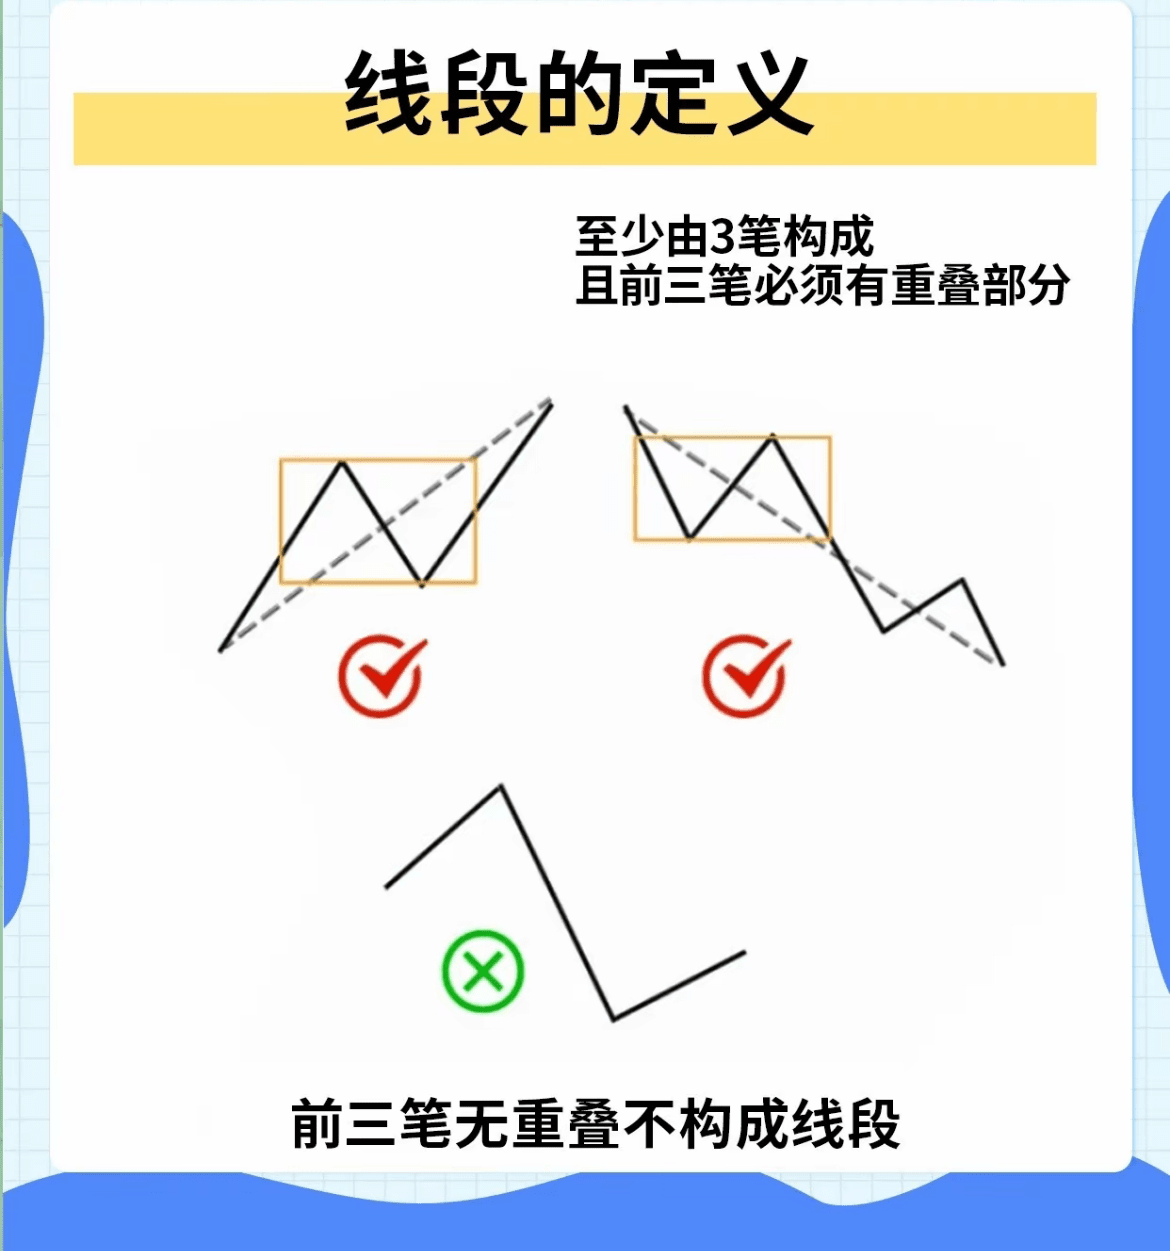
As shown in Figure 10, the definition of a 'segment': At least three consecutive 笔 with overlapping relationships constitute a segment. In an uptrend, the line connecting the first 'trough' and the last 'peak' of these three 笔 constitutes an 'upward segment'; in a downtrend, the line connecting the first 'peak' and the last 'trough' of these three 笔 constitutes a 'downward segment'.
It is particularly important to note that in a segment of an uptrend, there may be more than three 笔. As long as the '笔' beyond the first three do not form another three or do not form another three after that and do not appear as a 'downward segment', you only need to connect the first 'trough' and the last 'peak' (this content involves '笔 destruction' and 'segment destruction', which will be explained in detail in subsequent articles, and will not be elaborated here).
Chapter Summary:
Formations, 笔, and segments are the most basic elements in the theory of Chán. Each element is interlinked, and only by accurately finding completed peak and trough formations can you draw 笔. After drawing the 笔, you can find the segments, and after finding the segments, you have the opportunity to identify the 'central point' often mentioned in live broadcasts, thus determining buying and selling points as well as precise support and resistance levels.
The article's content is somewhat convoluted because Chán theory itself belongs to mathematical geometric theory, which is rigorous and therefore convoluted. Students reading must interpret it repeatedly and word by word, and practice drawing lines in real trading; practice is the only standard to test truth. Don't just stay in theory; seemingly understanding will definitely lead to various problems in real trading. If there are any issues, they must be raised during the square live broadcast at 8 PM, otherwise, it will severely affect the subsequent learning progress of Chán theory.
Congratulations to the students who patiently read this article 🎉 because you have already taken the second step in learning Chán theory. Everything is difficult at the beginning. If you want to stand out in front of others, you must endure hardships behind the scenes. For stable long-term profits and to say goodbye to margin calls, everything is worth it! Keep going, and Yánshèng is with you! 🥳 Leave the classic quote of Chán theory 'The trend ends perfectly' and the slogan of Yán's family 'Words lead to coin victory' in the comments, so I know you are making progress! Yánshèng Bit - Binance's ace KOL chatroom $BTC #币安Alpha上新