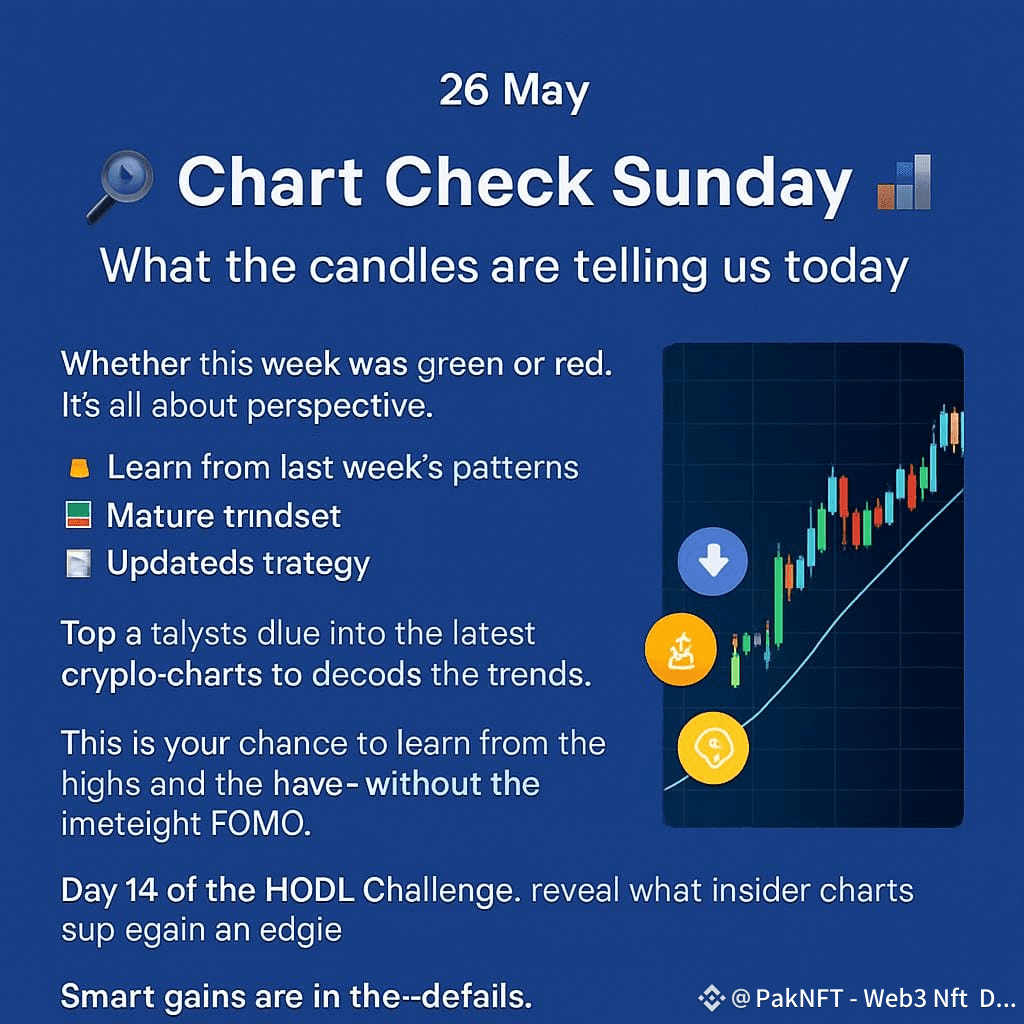
To analyze what the candles are telling us on May 21 to 26 study candlesticks, we'll need to look at the candlestick chart patterns. Here are some key points to consider:
Understanding Candlestick Charts $BNB
- Candlestick Components: Each candle represents the open, high, low, and close prices for a specific period.
- Market Sentiment: Green candles indicate buying pressure, while red candles indicate selling pressure.
Kwey Candlestick Patterns
- Doji:
Indicates indecision in the market, where buying and selling pressures are balanced. This can potentially lead to a trend reversal.
- Hammer:
Suggests a potential trend reversal, with a long lower wick indicating buying pressure.
- Shooting Star:
A bearish signal with a long upper wick, indicating selling pressure.
- Harami: A small candle within a larger candle, indicating potential trend reversal ¹ ²
Analyzing the Chart
To accurately analyze the chart on May 26, we would need to see the actual candlestick patterns. However, based on common patterns:
- A series of green candles may indicate an uptrend.
- A series of red candles may indicate a downtrend.
- A doji or hammer pattern may signal a trend reversal.
Keep in mind that candlestick patterns have varying degrees of accuracy, with some sources suggesting 70-80% accuracy for certain patterns.
