🔍 Technical Summary from Indicators (according to Binance data):
🔸 Technical Summary:
Technical Indicators Summary for SOL/USDT (from TradingView):
🕒 1 Month Timeframe (Monthly):
🔵 Technical Indicators: Indicate a Buy state
🔵 Moving Averages: Give a strong Buy signal
📉 Long-term momentum is positive but has not yet reached an overbought level
🗓️ 1 Week Timeframe (Weekly):
🔵 Technical Indicators: Leaning towards Buy
🔵 Moving Averages: Clear Strong Buy
📉 Upward movement supported by strong bullish momentum on the MACD indicator
📆 1 Day Timeframe (Daily):
🟢 Technical Indicators: Leaning towards Buy
🟢 Moving Averages: Still in the Strong Buy area
⚠️ Note: Momentum has started to decline, and MACD shows a slowdown
🕓 4-Hour Timeframe:
🟡 Technical Indicators: Mixed with a tendency towards Neutral
🟡 Moving Averages: Still in Strong Buy
🔺 However: Clear signs of weakness in the momentum indicator and MACD has entered correction
📉 MACD and Volume Analysis (according to Binance data):
MACD (on daily and weekly timeframes) is still in a positive area but has started to slow down on the daily and 4-hour, indicating a potential short correction.
Trading volume over the past days saw a peak and then began to decline, supporting the idea that current momentum is gradually weakening.
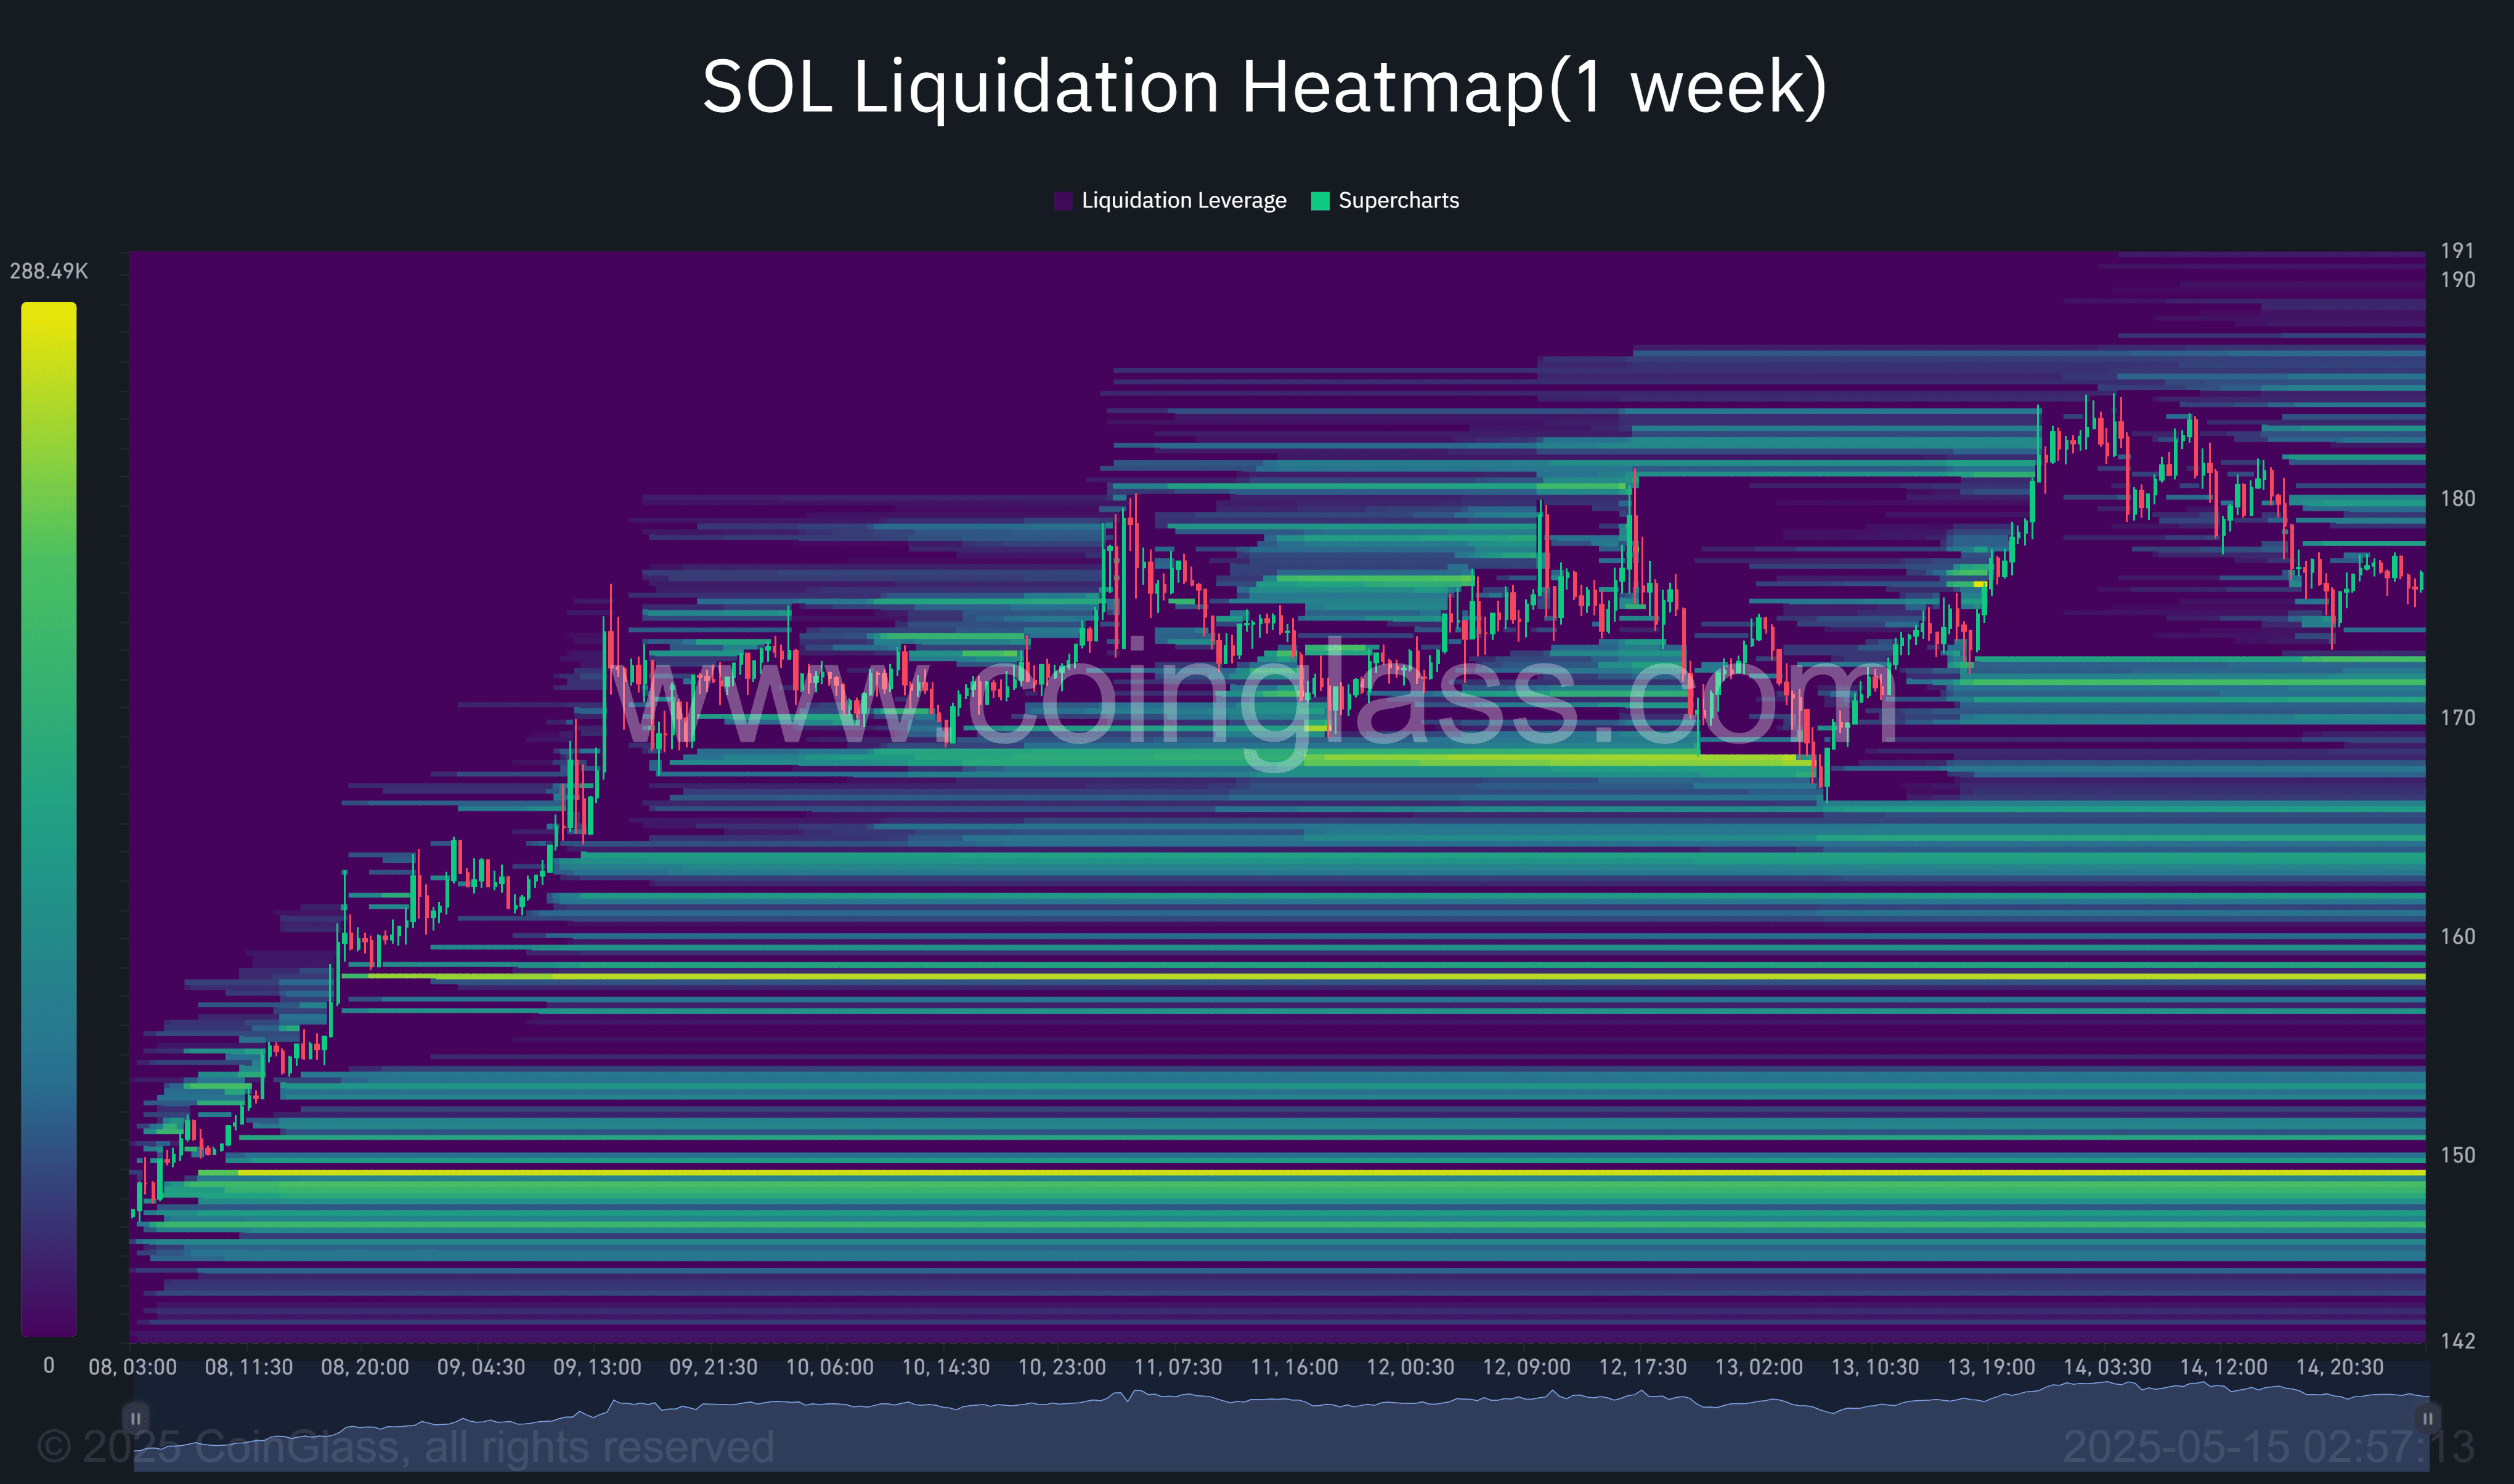
🔥 Heatmap Analysis for Liquidation - Coinglass:
(1 Month): Strong buying momentum started from the 140–150 USDT area, with liquidation clusters between 180–185 indicating potential strong resistance there.
(1 Week): Clear liquidation pressure above 180, reinforcing the idea that surpassing this barrier in the short term is challenging.
(24 Hours): Notable liquidation frequency between 175–178, indicating the market is in a sensitive stage.
📍 Important Technical Areas:
Accumulated Monthly Support (BB + MA100) - 147–160
Daily Technical Support + Moving Averages - 168–170
Current Strong Resistance - 184–186
Previous Peak - Potential Breakout Target 200–210
📈 Overview:
🔸 Overall Trend: Clearly bullish on monthly and weekly, supported by a breakout of a double bottom pattern and improvement in technical structure.
⚠️ However, on shorter timeframes (4H and 1D): Momentum has begun to retreat, and if 184.88 isn't surpassed soon, we may see a retest of the 168–170 area as initial support.
🧠 Conclusion:
Continued momentum needs a clear and stable breakout above 185.
Failure to do so could push the price to test 170–168.
The long-term bullish scenario remains intact as long as 147 is not broken.


⚡ Risk management is the key to success! 🚀
📢 Disclaimer: Analysis is not financial advice; make your decisions wisely. 🚨