#Ethereum Strong rise: Has the expected rebound finally begun? – Technical analysis from May 14, 2025
17:10 ▪ 8 min read
Ethereum shows a rebound of more than 50% in less than two weeks. Find our complete analysis and current technical outlook for ETH.
In summary
Technical analysis: ETH in strong acceleration: driven by a weekly increase of +38.5% and soaring volumes (+154%), ETH shows a solid bullish dynamic across all timeframes, despite moderate disinvestments in spot ETFs.
Key levels: ETH remains bullish above $2,105, supported by key levels of $2,407, $1,723, and $1,471, but approaches a dense resistance zone between $2,740 and $3,746, with a market equilibrium delineated between $1,630 below and $3,325 above.
Derivatives analysis: Market signals remain bullish, among rising open interest, absorption of sales, and liquidations of short positions, but rising funding calls for caution in case of continued progression.
Forecasts: The bias remains bullish above $2,407, with a potential of +30%, but a break would expose the market to a correction of up to -45%, depending on the impact of upcoming macroeconomic factors.
Technical analysis ETH/USD
Indicator Status Comment Spot price $2,625 Strong bullish extension after surpassing key levels. Latest weekly changes +38.5% The price marked its largest weekly increase of the year, a sign of bullish acceleration. Latest weekly volumes $31.3 billion (+154%) Increase in volumes, in line with the strength of the bullish movement. Long-term trend (SMA 200) Bullish Gradual increase in the long-term trend. Medium-term trend (SMA 50) Bullish Established bullish structure in the medium term. Short-term trend (SMA 20) Bullish Sustained rise, with no immediate signs of weakness. Momentum Up The momentum confirms its increase, with oscillators clearly accelerated. ETH spot ETF flows (net flows) Moderate disinvestments The ETFs show moderate disinvestment, indicating a measured retreat of institutional buying interest.
ETH shows a strong recovery with a spot price of $2,625, driven by a weekly increase of +38.5%, the most significant of the year. This growth is accompanied by a significant increase in volumes (+154%), reflecting a marked reactivation of participation. Trends are now bullish across all timeframes (SMA 20, 50, and 200), indicating a well-established structural dynamic. The momentum remains strong, with oscillators in clear acceleration, confirming the strength of the movement. The only notable caveat: moderate disinvestments in ETH spot ETFs, signaling a measured retreat of institutional buying interest.
Key levels of Ethereum
Indicator Status Comment Resistance $2,740 / $2,924 / $3,527 – $3,746 Critical zones, possible distribution thresholds. Support $2,407 / $1,723 / $1,471 Major defense levels, likely accumulation zones. Latest daily breakout $2,105 Resistance surpassed; confirmation of the bullish bias. Monthly pivot point $1,711 Reference level for the monthly trend below the price. High value zone $3,325 High volume zone; upper limit of market equilibrium, beyond which an imbalance may arise. Low value zone $1,630 High volume zone; lower limit of market equilibrium, beyond which an imbalance may arise.
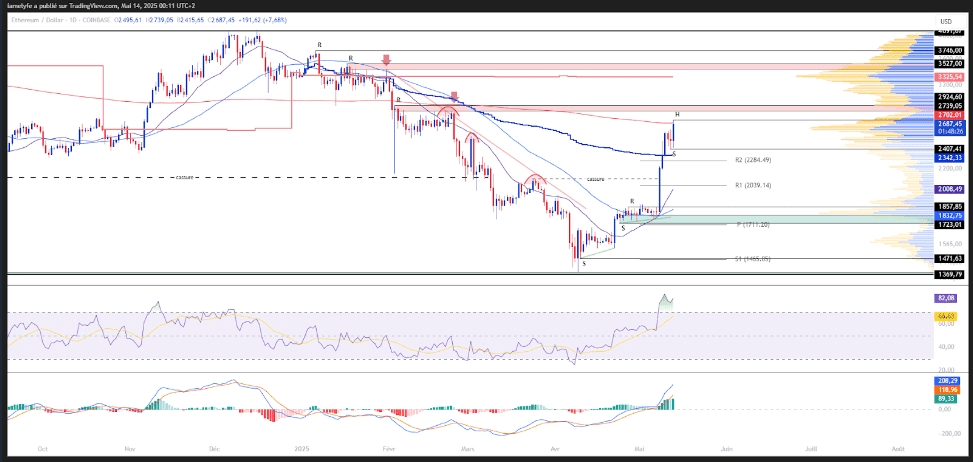
Ethereum is still inscribed in a bullish dynamic confirmed by the recent daily breakout at $2,105, with well-identified support levels at $2,407, $1,723, and $1,471, which could serve as accumulation zones in case of a pullback. The monthly pivot point at $1,711 serves as a reliable trend reference, always situated below the market. As it approaches key resistances between $2,740 and $3,746, the price is nearing thresholds that could provoke profit-taking or a slowdown. Two well-defined value zones frame the cryptocurrency: one below $1,630, supporting the idea of a solid buying foundation, and another above $3,325, indicating a possible limit to progress, beyond which an imbalance could arise.
ETHUSD Daily Chart
 Derivatives analysis (ETH/USDT)
Indicator Status Comment Open interest Increasing Growing speculative activity, showing increased interest CVD Selling absorption Divergence showing the presence of sellers, absorbed by passive buyers Liquidation Strong, on the short side Notable liquidations in short positions, a sign of seller capitulation. Funding rate slightly positive Moderately high funding rate, indicating a bullish bias without marked excess speculation.
Market data indicates a globally favorable environment for buyers, although without excessive euphoria. The increase in open interest reflects a rebound in speculative activity, while the CVD highlights selling absorption, a sign of discreet but active market support. The wave of short-side liquidations suggests seller capitulation, mechanically reinforcing the bullish dynamic. The funding rate, positive and growing, reflects a rising buying bias; an evolution to watch, as excess leverage could weaken the dynamic in the event of a sudden market drop.
Open Interest / Liquidations / CVD and funding rate Selling liquidation zone ≈ $2,850 – $3,050 / $3,424 – $3,790 / $4,124 – $4,250 Sensitive areas in case of breakout, risk of bullish amplification. Buying liquidation zone ≈ $2,416 – $2,370 / $1,906 – $1,865 / $1,835 – $1,605 / $1,537 – $1,500 Critical downside thresholds, potential flush zones.
The market identifies several selling liquidation zones situated between $2,850 and $3,050, $3,424 and $3,790, as well as $4,124 and $4,250. These levels constitute sensitive areas in case of a breakout, which could trigger bullish amplification if surpassed with volume.
Conversely, the buying liquidation zones are more numerous and extensive, covering ranges from $2,416 to $2,370, $1,906 to $1,865, $1,835 to $1,605, and $1,537 to $1,500. These thresholds represent critical downside zones, where the market is exposed to significant risks of a rapid flush in case of accelerated correction.
BTC liquidation heatmap
Discover the Bitpanda platform This link uses an affiliate program.
Price forecasts for Ethereum (ETH)
Bullish scenario:
Conditions: Stay above $2,407.
Targets: $2,739 / $2,925 / $3,527 and more.
Potential: +30% from the current level.
Bearish scenario:
Conditions: Break of support at $2,407.
Targets: $2,110 / $1,723 / $1,471.
Potential: drop of up to -45%.
Comment:
The bias remains bullish, although a possible short-term correction cannot be excluded. Upcoming macroeconomic indicators, as well as Jerome Powell's speech, could play a key role in validating or invalidating this scenario.
Conclusion
Ethereum operates in a clearly bullish context, driven by strong participation and a solid technical dynamic. The market structure remains favorable, with well-established support zones and resistances to watch in the short term. Derivative market data confirms a rebound in buying interest, without notable excess. The bias remains positive, although a technical pullback cannot be ruled out in case of specific pressure. In this context, it will be essential to closely monitor price reactions at strategic levels to confirm or adjust current forecasts.
#Bitcoin: Ongoing bullish reprise! Technical analysis from May 13, 2025
#Ethereum unlocks millions to prepare for the post-quantum era