
Technical Analysis of Bitcoin (BTC/USD)
Market Trend and Chart Structure:
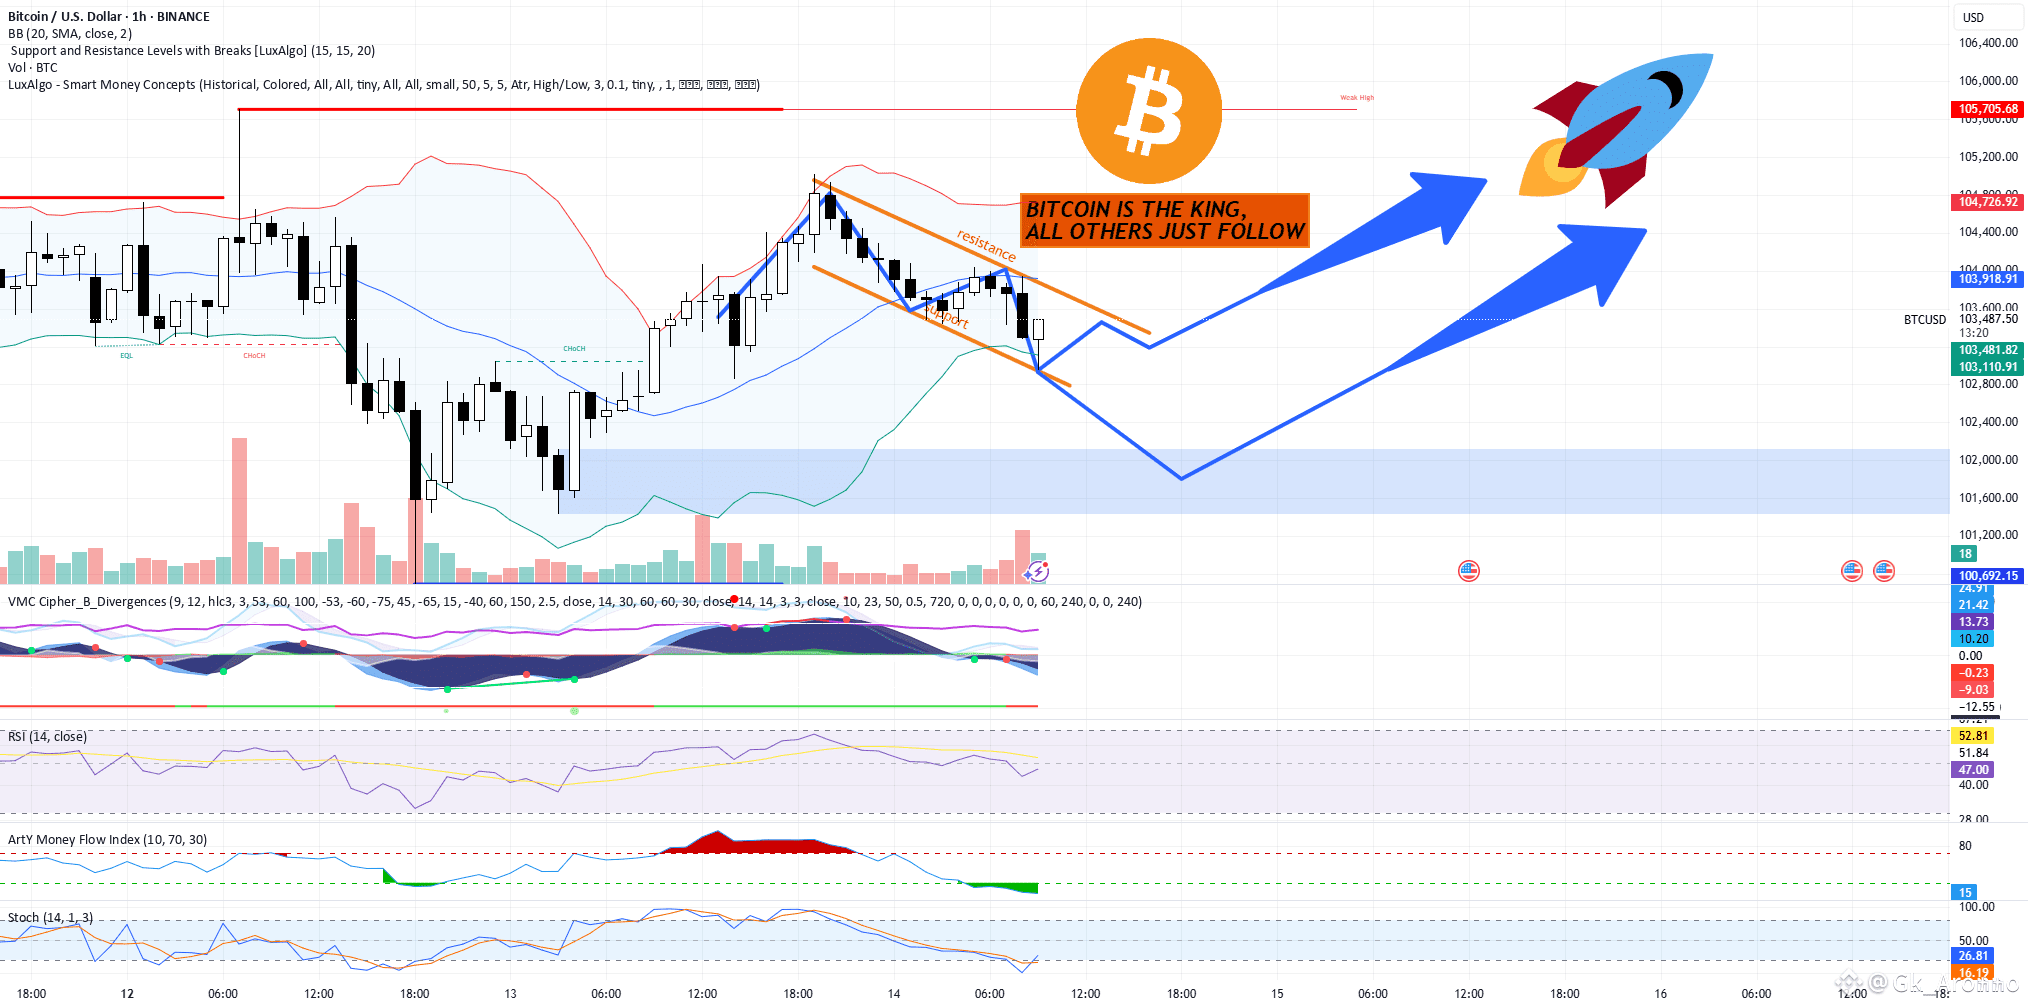
The price of Bitcoin is in a consolidation phase as shown in the descending channel pattern formed by the resistance and support lines.
The market is moving within this range, but there is a strong possibility of a breakout to the upside based on the bullish divergence forming on the indicators and the overall market sentiment.
The chart also shows Bollinger Bands (BB), which are in a squeeze, signaling a potential breakout. Typically, this indicates that volatility is low, and the price could move sharply in either direction once the bands break.
Key Indicators and Signals:
MACD: The MACD indicator is showing a bullish crossover, which indicates the possibility of a trend reversal to the upside.
RSI (Relative Strength Index): Currently at 45.78, indicating that the market is neither overbought nor oversold. This suggests that Bitcoin is in a neutral zone, but with bullish signals from other indicators, an upward move seems likely if momentum continues to build.
ArtY Money Flow Index: The Money Flow Index is showing green bars, suggesting that capital is flowing into Bitcoin, which supports the bullish outlook.
Stochastic RSI: The stochastic is in the oversold region (currently at 14.99), which usually signals a potential reversal to the upside.
Resistance and Support Levels:
Resistance: The primary resistance level is located at $105,705. A break above this level would indicate a strong upward move.
Support: The primary support level is around $101,600. If the price reaches this level and holds, it could act as a potential bounce point for a reversal.
Trading Strategy and Plan:
Entry Strategy:
Buy Entry: Enter a long position if the price breaks above the $104,700-$105,705 range, indicating a breakout above resistance. A confirmation from the MACD and RSI would add strength to this signal.
Stop Loss: Set a stop-loss order at $101,000, below the key support, to manage risk if the market reverses unexpectedly.
Target/Exit Strategy:
Take Profit Target: A good target is at the $110,000 level, where Bitcoin could face another resistance. A more aggressive target could be at $115,000, but this would require a continuation of the bullish momentum.
Trailing Stop: Use a trailing stop as Bitcoin continues to move upward to secure profits if the price continues to climb without retracing.
Risk Management:
Maintain a risk-to-reward ratio of at least 1:3, meaning you should aim for profits that are at least three times the amount of risk you take. This will ensure better risk management in case the market reverses unexpectedly.
Monitor the market sentiment closely. Bitcoin's price movements can be highly volatile, so being ready to adjust stop-loss and take-profit levels is essential for successful trading.
Bitcoin is showing positive signs of breaking to the upside, with support from key technical indicators such as bullish MACD crossovers, oversold stochastic levels, and a neutral RSI. It’s essential to monitor the breakout above the $104,700-$105,705 level, which could signal a strong upward move. However, traders should use proper risk management techniques, such as setting stop-loss orders and managing position sizes carefully.
Always stay updated with market news and adjust your strategy based on any significant news or changes in the overall market sentiment.
#TradeLessons #NewsTrade #TrumpTariffs #BinanceAlphaPoints #BinanceAlphaAlert