
After rising nearly 160% in the past week, Pi Coin's price today shows the first signs of weakness. As of now, Pi is trading around $1.21, slightly down from the short-term peak of $1.30 reached on May 14. The downward momentum is pulling Pi towards an important short-term support area around $1.144. Although Pi Coin's price previously surged despite the overall market volatility, the short-term upward momentum is currently showing signs of stagnation, raising the possibility of a correction or sideways movement in the near future.
What Does the Technical Chart Say About Pi Coin?

On the 4-hour time frame, Pi Coin had been moving within an expanding Bollinger Bands structure until May 13, when the price broke the $1.30 mark and peaked near $1.47. However, the upward momentum was not sustained, leading to a strong sell-off, pulling the price back to the central line of the Bollinger Bands at $1.16, which is currently acting as temporary support.
On the 30-minute chart, Pi Coin is forming a descending triangle pattern, with the bottom at the $1.144 area and resistance at $1.33. The candles are continuously being rejected at the upper downtrend line, indicating weakening buying pressure at higher price levels.
On the daily chart, the price structure remains bullish but shows upper wicks, reflecting selling pressure at local peak areas. Although previous breakouts from the $0.90–$1.00 area are still valid, buyers need to defend the $1.144 area to avoid the risk of a deeper correction to $1.00–$1.05.
Technical indicators show that daily momentum is weakening.
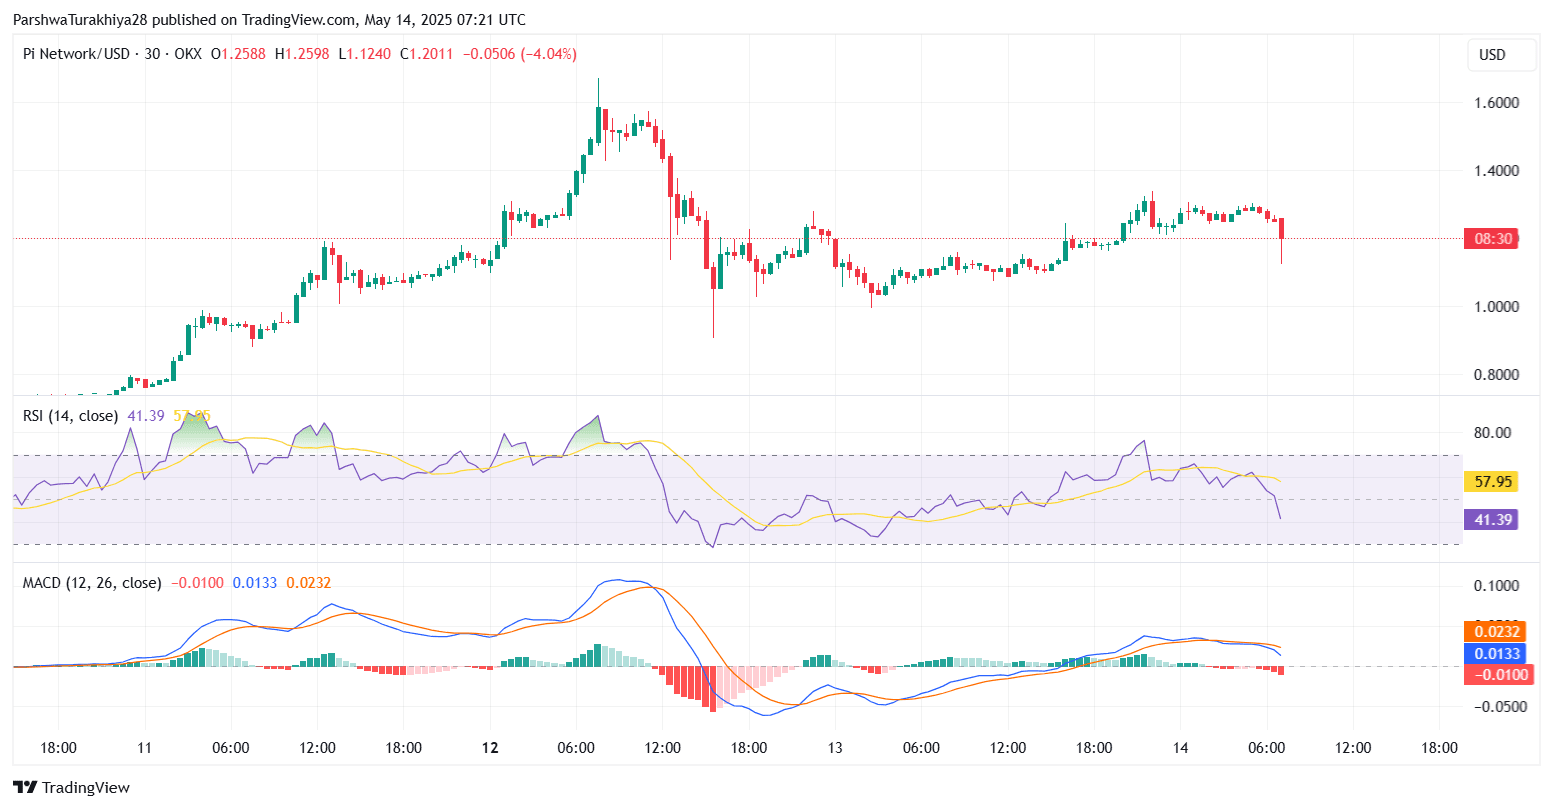
RSI (Relative Strength Index) on the 30-minute chart has dropped to 41.39, far from the nearly 70 level on May 13, indicating a clear bearish divergence.
MACD has crossed below the signal line, further reinforcing the possibility of a correction if buying pressure does not return soon.

On the 4-hour chart, Pi is still trading above important EMA lines:
EMA20: $1.11
EMA50: $0.94
This confirms that the medium-term trend is stillpositive, however Bollinger Bands are narrowing, indicating that price volatility is compressing, which is often a signal of an impending breakout or breakdown.
The Ichimoku cloud on the 30-minute chart also shows indecisive signals: the price is currently within the Kumo area, with the Tenkan and Kijun lines flat — typically a phase of the market lacking a clear trend.
Why is Pi Coin's price declining today?

The main reason for today's decline is that the price had increased too quickly during the period from May 8 to 12. After doubling in value, profit-taking pressure began to appear strongly around the $1.47 area, leaving many long wicks above on various time frames.
At the same time, trading volume at high price areas is not large enough, coupled with weakening signals from MACD and RSI, causing buying pressure to be unsustainable. This allows sellers to pull the price down to the $1.20 area.
The Chaikin Oscillator on the 30-minute chart has also turned negative, indicating that accumulation pressure has diminished after the previous breakout.
Short-term Price Forecast for Pi Coin: What Scenarios Could Occur?

If the price rebounds from the $1.144 area with good trading volume, it could open up opportunities for a recovery back to the $1.30 area, followed by $1.33. Further out, potential resistance areas are at $1.47 and $1.60.
Conversely, if the price breaks below $1.144, selling pressure could push the price down to deeper support areas around $1.05 and $0.99 — coinciding with EMA50 and the previous horizontal support structure.
Pi Coin Forecast: May 15

Conclusion
The main trend on the daily and 4-hour charts remains positive, but the daily momentum is clearly decreasing. In the next 24 hours, the $1.144–$1.164 range will play a decisive role in determining the short-term direction of Pi Coin. Investors and traders should closely observe price reactions in this area to devise appropriate strategies.